 Banking Software Development
 Our Work Process
 Awards


The eWallet market is bigger than ever, with billions and trillions of users. If you are someone who wants to learn more about the digital wallet market, this blog is for you.
Here, we shall be discussing all the important digital wallet statistics and trends, covering popular apps, transactions, digital wallet app adoption in specific regions, and much more. Read till the end to gain a detailed insight into the mobile wallet market.
Rise of eWallets: An Overview
Digital wallet apps, mobile wallets, or eWallet apps, whatever you call them, everyone is using them.
Today, eWallet mobile apps are by far the most popular form of fintech solution, becoming a household name and being used by billions of users across the world. And through this, apps like PayPal, Venmo, and Cash have generated billions in revenue.
Amazing, right? Well, over the years, eWallet apps have come a long way. A few decades ago, sending money remotely used to be a long process, but eWallet apps changed all of this.
Not only do they empower us to make transactions possible, but the features of e-wallet apps let users automate bill payments, book flights and bus tickets, pay rent online, recharge smartphone plans, manage accounts, and much more.
Today, digital wallets are the epitome of modern fintech technology, picking interest from both users and companies.
To better understand how the field has changed over the years, let’s dive into the digital wallet statistics.
Key Digital Wallet Statistics: Takeaways
- The global digital payment market size was valued at $111.2 billion in 2023, and is anticipated to reach over $193.7 billion by 2028, with a robust CAGR of 11.8% during the forecast period.
- The mobile payment market in the United States is expected to reach a projected revenue of US $117, 206.8 million by 2030.
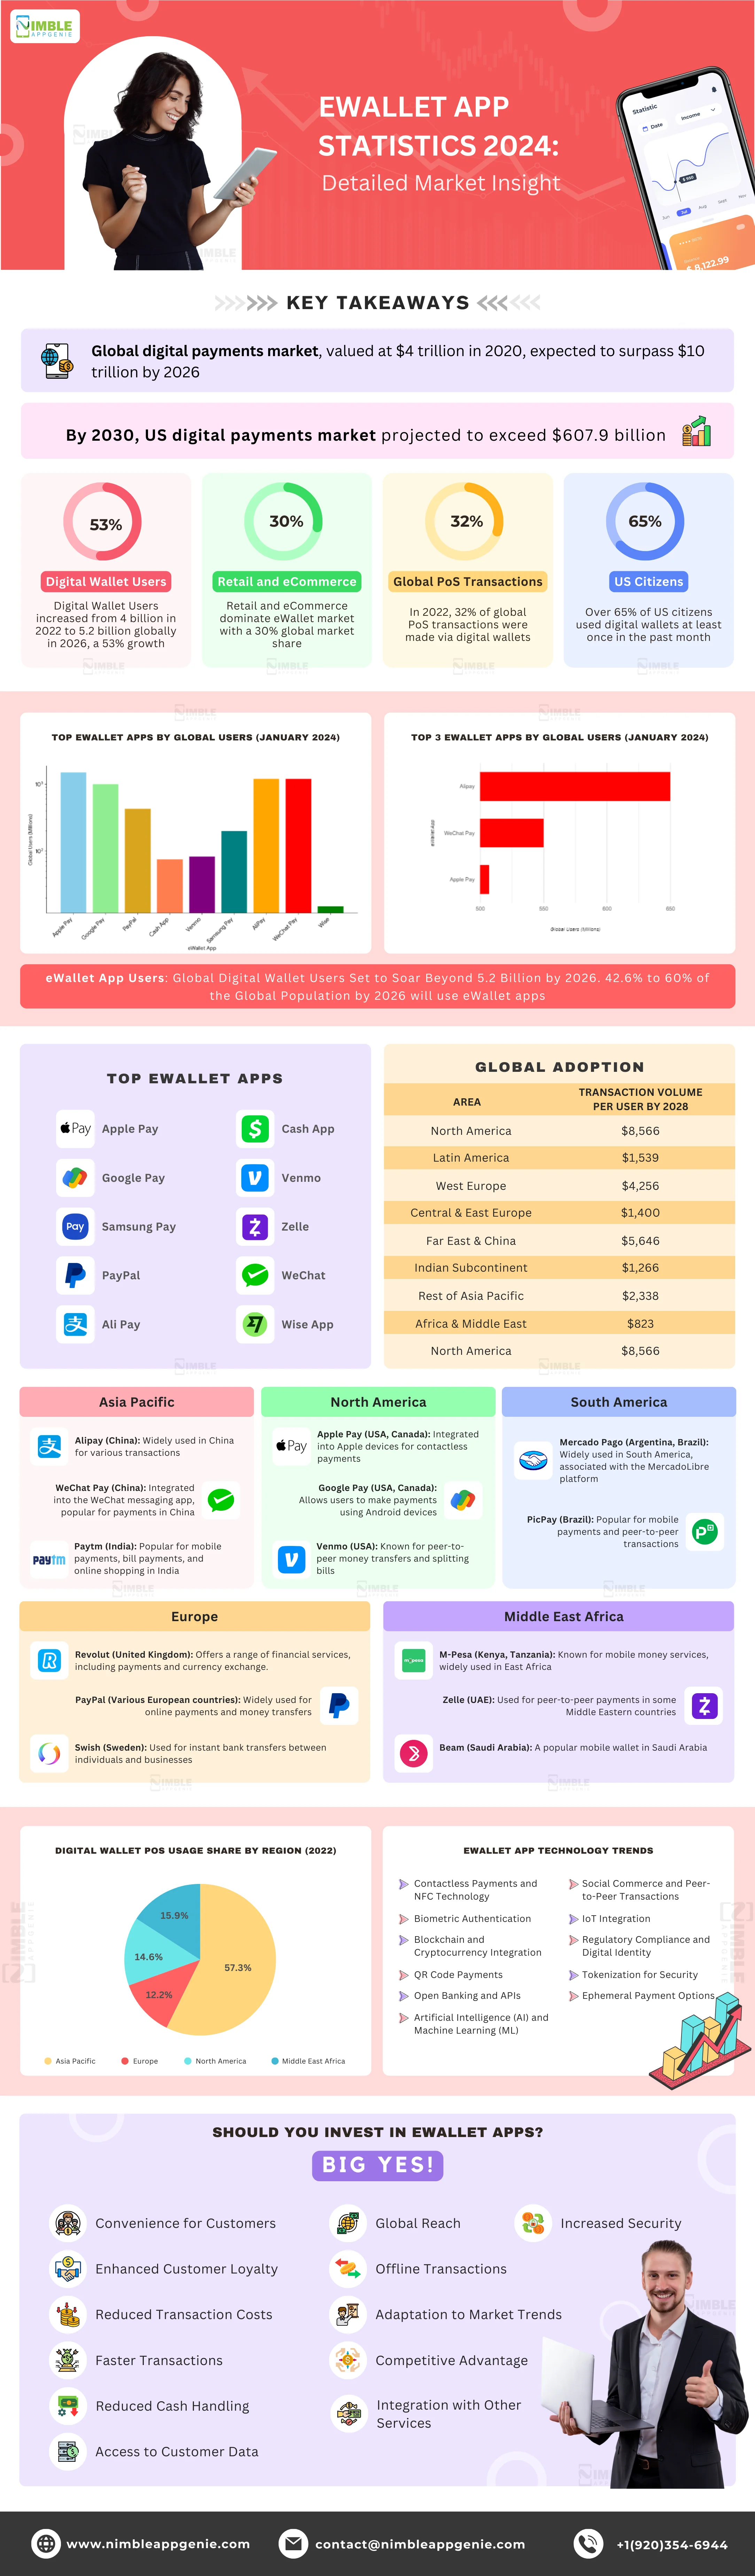
- According to Juniper Research, the total number of digital wallet users will exceed 5.2 billion globally in 2026, having increased from 3.4 billion in 2022, and represent a growth of over 53%.
- More than 65% of U.S. consumers have used digital wallets at least once in the past month, showing how much people love using these wallets.
- By technology, the proximity segment accounted for the largest revenue share of 62.6% in 2022.
- Stats from back in 2022 show us that 32% of global PoS transactions were made via a digital wallet, making it the most popular method.
- Most popular eWallet apps include PayPal, Apple Pay, and Google Pay in the US.
These numbers are being driven by the top eWallet app trends gaining traction globally in 2026.
Here is the complete table stating the stats summary in short about digital wallet statistics.
| Metric | Current Value (Stated Year) | Projected Value (Future Year) |
| Global Digital Payments Market | $111.2 billion (2023) | $193.7 billion (2028) |
| U.S. Mobile Payment Market | — | $117,206.8 million (2030) |
| Global Digital Wallet Users | 3.4 billion (2022) / 4 billion (2022 alt.) | 5.2 billion (2026) |
| Global Digital Wallet Transaction Value | $7.5 trillion (2022) | $12 trillion (2026) |
| QR Code Wallet Payments | $2.4 trillion (2022) | $3+ trillion (2025) |
| Global Population Using Digital Wallets | 42.6% (2022) | 60% (2026) |
| East & China Mobile Wallet Transaction Value | $3,581.22 billion (current) | $5,704 billion (2025) |
| Social Commerce Revenue | — | $6+ trillion (2030) |
| APAC POS Share via Digital Wallets | 47% (2022) | 59% (2026) |
| APAC Online Payments Share via Digital Wallets | 69% (2022) | 73% (2026) |
| Europe Online Payments Share via Digital Wallets | 29% (2022) | 32% (2026) |
| North America Online Payments Share via Digital Wallets | 32% (2022) | 41% (2026) |
| MEA Online Payments Share via Digital Wallets | 20% (2022) | 27% (2026) |
Top Digital Wallet Apps & Statistics
In this section of the digital wallet statistics, we shall be looking at the top digital wallet apps in the market and how they affect the market.
1. Apple Pay
The first on the list is Apple Pay, the well-known market leader from the trio, Apple Pay, Google Pay, and Samsung Pay.
Apple Pay holds a 54% share of in-store mobile wallet usage in the US. The platform processes 14.2% of all online consumer payments; however, Gen Z leads Apple Pay usage at 8.8%.
2. Google Pay
One of the best payment apps on the market, Google Pay is Android’s entry into the digital payment world.
Over 2.1 billion transactions were processed by Google Pay in 2025, that is showing a 30% increase from the previous year.
3. PayPal
With so many people looking for apps like PayPal, this mention on the list needs no introduction.
PayPal Holdings’ revenue for the quarter ending March 31, 2026, was $8.353B, a 7.21% increase year over year. Thus, it has seen a massive increase in revenue when compared with the previous year.
4. Cash App
Do you want to build an app like Cash App? Well, you aren’t the only one. With the popularity of this solution from Square skyrocketing, it’s a popular platform.
Cash App generated $12.3 billion in revenue in 2021; 81% of that came from Bitcoin. Additionally, the app has 44 million monthly active users and over 100 million downloads.
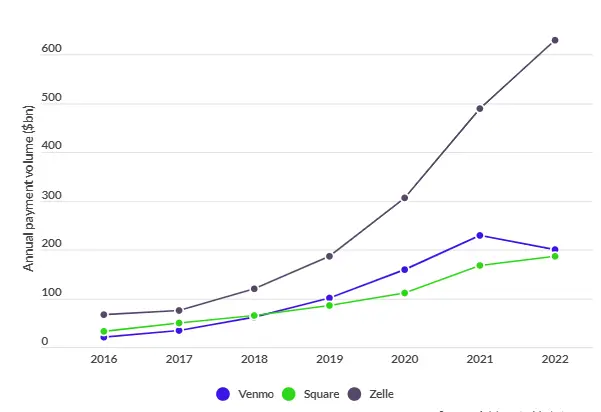
5. Venmo
Venmo has been the flag bearer of mobile payments in the US. When this app came around, mobile payment apps were non-existent.
Venmo generated approximately $1.7 billion in revenue, representing a 20% year-over-year increase.
6. Zelle
Zelle’s business model is unique in the sense that it is an effort from all major US banks to enter the market, coming out of Venmo and Cash app’s shadow.
As per CNBC, Zelle crossed $1 trillion in total volumes last year, which it said was the most ever for a peer-to-peer platform. The payments network said its user base jumped 12% to 151 million accounts in 2024.
7. Samsung Pay
Following right behind Apple Pay and Google Pay, Samsung Pay is a personal solution for digital wallet payment for Samsung users.
Digital wallet industry statistics show it is particularly popular among Asians, especially in South Korea.
8. AliPay
Let us introduce you to the largest mobile payment platform in the world, AliPay.
In 2023 alone, the platform had over 10 million visits, with a core audience of 2.2 million. In China alone, more than 900 million people have used the platform.
9. WeChat Pay
Behold the powerhouse of payments in China!
WeChat Pay takes center stage as the second-largest payment platform in the country, effortlessly swaying through the digital landscape as the default payment maestro on WeChat.
10. Wise
With the symphony of international transfers, apps have orchestrated a revolution.
These were some of the important digital wallet statistics to look at when it comes to opting for a digital wallet.
Other Related Digital Wallet Statistics
Explore key eWallet app statistics, including user adoption rates, transaction volumes, market growth trends, and industry forecasts, showcasing the growing dominance of digital payments.
Breaking this down by technology type, our guide on mobile payment technology explains what’s driving each segment.
1. Digital Wallet Dominance
Global digital wallet download statistics show that Alipay is leading the charge with a whopping 650 million users, showcasing its popularity on the world stage. Right on its heels is WeChat Pay with 550 million users, keeping the rhythm alive, and Apple Pay is grooving along with 507 million users.
2. User Landscape
19.1% of the world’s digital wallet users are swaying to the Alipay beat, followed closely by 16.2% immersed in the WeChat Pay vibe, and 14.9% experiencing the Apple Pay allure, shows digital wallet statistics.
3. Regional POS Champions
In the lively digital payments fiesta of 2023, PayPal took the lead on the dance floors of Mexico, the U.S., and Brazil, boasting impressive percentages – 64%, 58%, and 51% of consumers, respectively, getting their groove on at the point of sale.
4. Global PayPal Phenomenon
An impressive encore! Over 80% of consumers in 13 out of 21 surveyed countries, creating a dazzling 62% global footprint, chose PayPal for their online payments in 2023. The applause echoed from the U.S. to Germany and France.
5. Apple Pay’s UK Triumph
Crossing the English Channel, Apple Pay took the spotlight in 2023 as the reigning monarch of U.K. mobile payments. A regal 69% of digital wallet users pledged their allegiance, leaving PayPal trailing behind at a mere 31%, like a loyal subject.
6. Google Pay’s Indian Extravaganza
The Indian subcontinent witnessed a digital carnival, and Google Pay emerged as the undisputed headliner in 2023. A staggering 82% of consumers swayed to its rhythm in-store, while 77% couldn’t resist its charms online, making it a double act that outshone any other country’s performance.
7. Digital Wallet Synergy
In the grand symphony of digital transactions, harmonies were found as 88% of Apple Pay users admitted to a secret rendezvous with PayPal. Not to be outdone, the trio of Google Pay, Cash App, and Venmo users matched the tune, with a resounding 89% confessing to a delightful dual allegiance.
eWallet App Usage Statistics: Transaction Volume
Now, it’s time to look at the eWallet app industry statistics based on the transaction volume across different criteria and areas.
1. North America vs. Asia: Digital Wallet Adoption to Double by 2025
Digital transaction global statistics from Statista show that North America anticipates a doubling of app usage like Apple Pay and Google Pay between 2020 and 2025.
However, the stage is set for Asia’s market to steal the spotlight, backed by the popularity of Alipay and Tenpay.
2. Juniper Research Forecasts Exponential Growth: $16 Trillion in Digital Wallet Transactions by 2028
Juniper Research’s eWallet app market insight projects a remarkable surge in digital wallet transactions from $9 trillion in 2023 to over $16 trillion by 2028. This growth promises a transformative evolution in global financial dynamics.
3. Forbes Study: Over Half of Americans Prefer Digital Wallets
The American fintech market has taken center stage as a 2023 Forbes study revealed that 53% of Americans have embraced digital wallets as their preferred payment method, surpassing traditional credit and debit cards. The digital revolution is reshaping consumer preferences across the nation.
4. Global Digital Wallet Transactions: $7.5 Trillion in 2022, Expected to Grow by 60% to $12 Trillion by 2026
The financial score reaches a crescendo, with the global total value of digital wallet transactions hitting $7.5 trillion in 2022. The next movement promises a harmonious growth of 60%, surpassing $12 trillion by 2026, signifying a global embrace of digital wallets.
5. QR Code Wallet: From $2.4 Trillion in 2022 to Over $3 Trillion by 2025
QR code payments pirouette into prominence, with mobile payments totaling $2.4 trillion in 2022. The choreography continues with a projected 25% increase by 2025, surpassing $3 trillion. By 2026, QR codes are set to lead the digital dance, accounting for 40% of all transactions by volume.
6. Consumer Spending Habits: The Average Mobile Wallet Transaction Hits $92.50 in 2022
Digital wallet active user statistics show us that the average mobile wallet transaction, valued at $92.50 in 2022, takes center stage. The melodious note outshines credit cards at $95.10, debit cards at $82.00, and cash at $61.20, reflecting a changing tune in consumer preferences.
7. Consumer Spending Dynamics: Digital Wallet Aficionados Outspend Debit Card Users by 12.8%
Mobile wallet statistics reveal an intriguing dynamic, where credit card users spend 2.8% more on average than digital wallet enthusiasts. Meanwhile, digital wallet aficionados outspend debit card users by 12.8% and surpass cash users by an impressive 51.1%, marking a transformative shift in consumer behavior.
eWallet App Usage Statistics: Transaction Volume
As per Juniper Research, it has been observed that the number of digital wallet users worldwide will increase by 35% over the next five years, rising from 4.4 billion in 2025.
As per Capital One Shopping, 4.5 billion consumers will use digital wallets in 2025, and the digital wallet user base will grow to 5.2 billion in 2026.
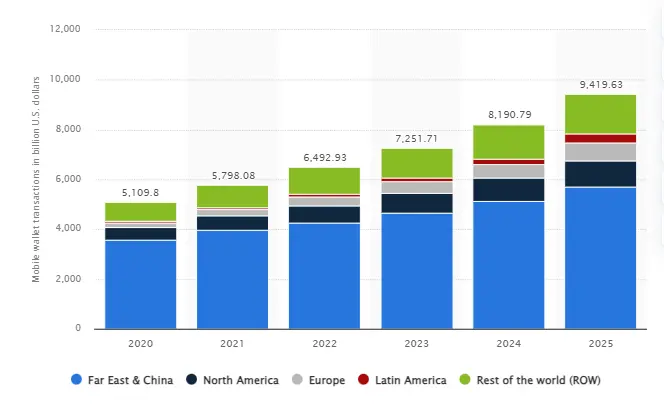
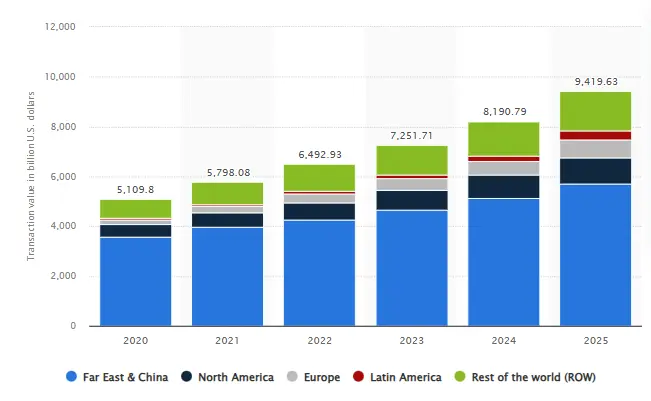
Mobile Wallet Transactions in Different Regions
Based on digital wallet statistics, the transaction value in East & China was 3,581.22 billion U.S. dollars, which is expected to grow to 5,704 billion U.S. dollars in 2025. In North America, it is 1,071.64 billion U.S. dollars. This represents a great opportunity to dive into the growing market.
Other Related Digital Wallet Statistics
Explore key eWallet app statistics, including user adoption rates, transaction volumes, market growth trends, and industry forecasts, showcasing the growing dominance of digital payments.
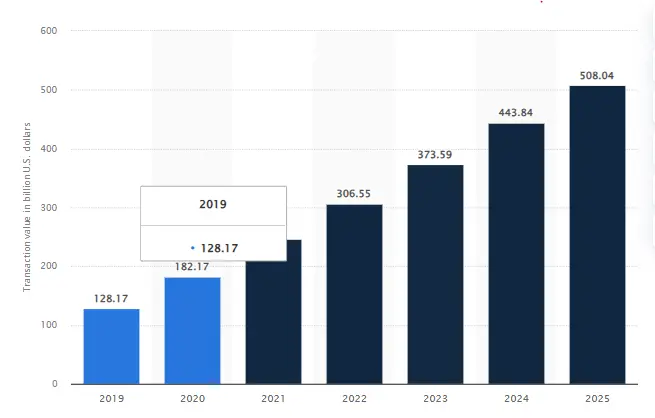
eWallet App Statistics till 2026
The digital wallet statistics forecast displays a proximity mobile payment transaction value of 128.17 billion U.S. dollars to 443.84 billion U.S. dollars in the year 2019 to 2024, which is further expected to reach a value of 508.04 billion U.S. Dollars in 2025.
Mobile Payment Statistics
In 2023, there were around two billion people around the world who used mobile payment apps. The transaction volume of the mobile payments apps reached $2.3 trillion in the same year, which is a 16.6% annual increase.
Additionally, retail e-commerce sales worldwide are forecast to climb 16.8% this year to $4.921 trillion. A 23.8% annual growth is expected between 2021 to 2026. 44.5% of all e-commerce transactions were made in 2020. These mobile payment statistics are expected to grow further in the coming years.
Digital Wallet Users Statistics
In this section of the eWallet app usage statistics, we shall be looking at market insight focused on users, let’s get right into it.
1] Global Digital Wallet Users Set to Soar Beyond 5.2 Billion by 2026: A Juniper Research Revelation
The digital revolution is poised to hit its peak as Juniper Research eWallet app statistics forecast a remarkable surge in digital wallet users globally.
From 3.4 billion users in 2022, the number is set to skyrocket by 53%, surpassing 5.2 billion by 2026, marking over 60% of the global population.
2] Global Adoption Landscape: 42.6% to 60% of the Global Population by 2026
According to 2022 eWallet app industry statistics, digital wallet users constituted 42.6% of the global population. Fast forward to 2026, and the landscape has transformed dramatically, with an estimated 60% of the global population embracing digital wallets. This meteoric rise signifies a seismic shift in how individuals around the world engage with financial transactions.
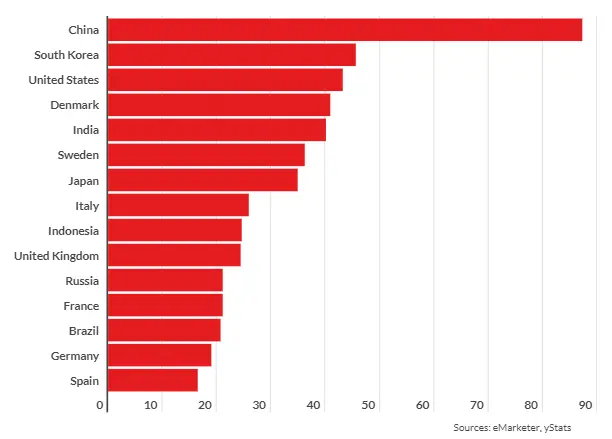
3] Regional Leaders in Digital Wallet Adoption: Thailand Takes the Lead in 2022
According to digital wallet industry statistics, Thailand took the lead in 2022, boasting an impressive 92% adoption rate among consumers.
Other major markets have followed suit, with India at 90.4%, China at 84.4%, and the U.S. at 49.9%, creating a global tapestry of digital wallet enthusiasts.
4] China’s Proximity Mobile Payment Dominance, 87.3% Adoption
China emerges as the virtuoso in proximity mobile payment statistics, with a staggering 87.3% of smartphone users making digital wallet transactions at a point of sale (POS) in 2021.
This marked an uptick from 81.1% in 2019, solidifying China’s leadership in the digital payments arena.
5] U.S. Proximity Mobile Payment Growth, 48.9% Increase
In the U.S., mobile payments peaked with 101.2 million smartphone owners embracing the trend in 2021.
This accounted for 43.2% of U.S. smartphone users, showcasing a robust 48.9% increase from 2019, underlining the growing acceptance of mobile wallets.
6] Digital Wallets to Replace Other Online Payment Methods by 145%
Global mobile wallet statistics show consumers are building a strong digital payment future, with a staggering 145% higher likelihood of using digital wallets over other online payment methods.
This preference underscores the growing trust and convenience associated with digital wallet transactions.
7] U.S. Digital Wallet Habits, Speed, and Convenience Reign Supreme
The growth of digital wallets in the U.S. is fueled by speed, with 80.6% of users preferring them for their swift transactions.
In addition, 76.9% favor digital wallets for their overall convenience, reflecting a dynamic shift in consumer preferences.
8] Debit Cards Dominate U.S. Digital Wallet Funding
According to Digital Wallet Industry statistics, in the U.S., 33% of users choose debit cards as their funding source, closely followed by credit cards at 31% and bank accounts at 20%.
This diverse funding landscape illustrates the versatility of digital wallet transactions. If you’re planning to build, here is the full breakdown of the cost to develop an eWallet app in 2026.
9] Groceries, Fast Food, and Gas in the Digital Wallet Limelight
The digital wallet market witnesses diverse performance, with 53.3% of users utilizing mobile wallets for grocery purchases, 20.6% for fast food, and 19.6% for gas transactions. This varied repertoire showcases the adaptability of digital wallets to everyday consumer needs.
10] Generational Divide and Youthful Dominance in Digital Wallet Adoption
Generational digital wallet user statistics tell us that 69.3% of Americans aged 18 to 25 and 73.7% of those aged 26 to 40 embrace digital wallets for payments. In stark contrast, only 30% of those over 57 have joined this digital payment ensemble, highlighting a clear generational divide in adoption trends.
Digital Wallet App Adoption Statistics
As the future is anticipated to be dominated by digital transactions, the stage is set for a staggering adoption of mobile payments, projected to reach 4.8 billion users by 2025.
These fintech statistics show that leaders in specific countries or regions are poised to experience not just a surge in users but a remarkable surge in revenue.
What makes this eWallet statistic particularly impactful is the deep integration of these mobile payment apps into the myriad of financial services offered by their providers.
Speaking of which, let’s look at the digital wallet adoption statistics for particular regions in the section below.
| Area | Transaction volume per user by 2028 |
| North America | $8,566 |
| Latin America | $1,539 |
| Western Europe | $4,256 |
| Central & Eastern Europe | $1,400 |
| Far East & China | $5,646 |
| Indian Subcontinent | $1,266 |
| Rest of Asia Pacific | $2,338 |
| Africa & Middle East | $823 |
| North America | $8,566 |
1] Asia-Pacific Region Overview
In the dynamic world of financial transactions across the Asia Pacific (APAC), digital wallets have emerged as a massive force, reshaping the landscape through rapid adoption and robust governmental support.
Let’s look at the Asia Pacific eWallet app industry statistics, which are as mentioned below:
-
Digital Wallets Contribute 47% To POS
In 2022, digital wallets commanded a prominent 47% share of point-of-sale (POS) payments across APAC countries. This victory was more than double the 21% contribution made by credit cards, showcasing the region’s inclination towards the convenience and efficiency of digital transactions.
-
Projected 59% growth in POS eWallet Usage by 2026
Looking ahead to 2026, the report anticipates further growth in digital wallet dominance in the POS arena. Projections suggest an impressive rise to 59%, while credit cards are expected to recede to a mere 18%. This transformative shift will solidify digital wallets as the preferred mode for in-person transactions.
-
Digital Wallet Transactions resulted in 69% of online payments
The online payment segment witnessed an amazing performance in 2022, with digital wallets covering 69%. Credit cards played the runner-up, contributing a modest 11%. This substantial gap underscores the digital wallet’s stronghold in the virtual payment sphere across APAC.
-
By 2026, eWallet apps will capture 73% of APAC online payments
The Future Score envisions eWallet app statistics by 2026, capturing a remarkable 73% of APAC online payments. Concurrently, credit cards are expected to fade, dwindling to a mere 10%. This projection solidifies the digital wallet’s role as the undisputed virtuoso in the realm of online transactions.
Factors Driving Electronic Wallets Growth in Asia Pacific:
-
High Smartphone Adoption
A pivotal factor in the region’s digital wallet surge is the widespread smartphone adoption. High mobile phone prevalence has become a catalyst, propelling the adoption of mobile payments and providing a foundation for the flourishing digital wallet market. UPI app development is the biggest example.
-
Government Support and Policies
Governments across the Asia Pacific have played an important role in supporting the digital payments market. The regulations & compliance aimed at encouraging growth has created a conducive environment.
Therefore, governmental backing has opened up room for innovation and the emergence of successful players in the electronic wallet market. For instance, the UPI and PayNow merger.

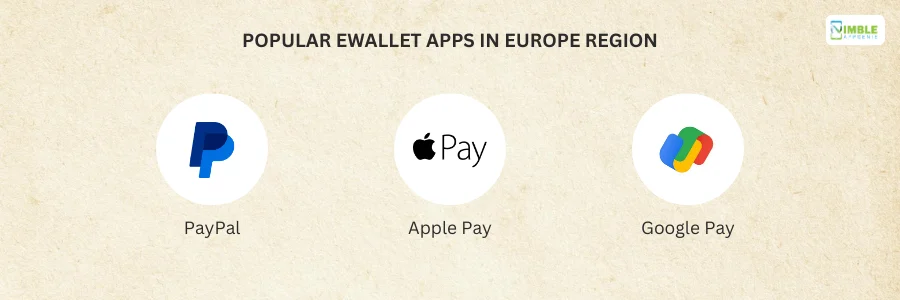
2] Europe Region Overview
Europe has been the place of origin for many trends and top platforms in the digital wallet industry. Let’s see how adoption is going via Europe digital market industry statistics.
-
POS Payments transactions 42% from mobile wallets
In terms of Point of Sale (POS) payments in 2022, debit cards claimed the leading role, commanding 42% of transactions. In contrast, digital wallets played a supporting role, capturing only 10% of the stage. This dynamic reflects the prevalent reliance on traditional debit cards for in-person transactions.
-
Online Payment from eWallet: 29%
Online payments are a different choreography in 2022, where digital wallets have emerged as the virtuoso, leading with 29% of transactions. This shift signifies a distinct preference for the digital realm, where the convenience of digital wallets takes precedence over other payment methods.
-
20% Growth in Digital Wallet Usage at POS, by 2026
Looking towards 2026, the script is set to evolve. Digital wallet usage at POS is projected to grow to 20%, showcasing a gradual but significant rise.
The online domain, however, witnesses a more pronounced surge, with digital wallets expected to command 32% of transactions. This projection underlines the accelerating acceptance of digital wallets in both physical and virtual transactions.
Factors Fueling Electronic Wallet Growth in Europe:
-
Contactless Payment Adoption
A key driving force behind the eWallet boom in Europe is contactless payments in eWallets. Much like any other part of the world, Europeans value the fast and convenient nature of such transactions.
Thus, having made contactless payments a preferred method for daily purchases. Consequently, e-payment apps’ tap-and-go feature has become synonymous with quick, secure transactions, as users effortlessly make payments with their smartphones or wearable devices.
-
Mobile Banking Revolution
Mobile banking app development stands as another pillar supporting the growth of online wallets in Europe. This technology is bridging the gap between traditional banks and innovative fintech companies, thus gaining popularity.
Moreover, apps seamlessly integrate payment features, enabling users to manage FinTech data, make payments, and access various banking services within a single platform.
The fusion of banking and payment functionalities in one app has driven the adoption of online wallets, further accelerating market growth. This is the reason why so many companies want to create a mobile banking app.
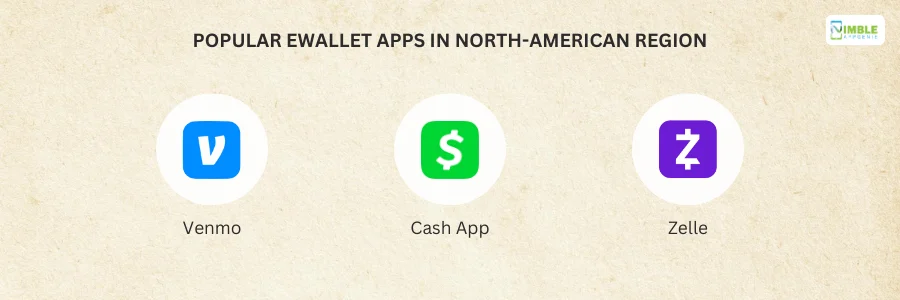
3] North America Region Overview
In the ever-changing North American FinTech landscape, there are some interesting eWallet app revenue statistics, led by the rise of mobile wallets and the enduring dominance of credit cards.
-
eWallet apps contribute 41% to POS sales
In 2022, North America witnessed the resonating dominance of credit cards at Point of Sale (POS), commanding a substantial 41%. This overshadowed digital wallets, contributing a modest 12%, highlighting the prevalent preference for traditional card-based transactions.
-
By 2026, Digital Wallet usage at POS is expected to increase by 16%
Fast forward to 2026, and credit cards are anticipated to maintain their stronghold in North American POS payments, dipping only slightly to 40%.
Debit card use will remain robust at 31%, while digital wallets are projected to experience a noteworthy ascent, reaching 16%. These eWallet industry statistics show a steady but notable evolution, where digital wallets carve a larger space in the POS arena.
-
Digital Wallets vs. Credit Cards
The digital duet unfolded in 2022, when digital wallets and credit cards engaged in a neck-and-neck competition. Digital wallets commanded a respectable 32%, just edging out credit cards at 31% in the online payment domain. This dynamic signifies the emergence of digital wallets as formidable contenders in the virtual transaction realm.
-
By 2026, online payments via digital wallets are expected to grow by 41%
Looking ahead to 2026, the script takes a decisive turn as digital wallets are poised to solidify their lead in North American online payments.
Projections suggest a rise to 41%, while credit card usage drops to 23%. This anticipated shift underscores the growing acceptance and preference for digital wallets in the online transaction landscape.
Factors Propelling Digital Wallet Growth in North America:
-
Increasing Adoption of Mobile Payment Solutions
North America’s digital payments software market is on a trajectory of consistent growth, propelled by the increasing adoption of mobile payment solutions.
The electronic payment apps’ convenience and security also contribute significantly to the expanding digital payment landscape. Consequently, a lot of big companies want to create money transfer apps.
-
EMV Chip Technology Adoption
EMV chip technology in North America, ever since it was introduced, has stood as a major driver for mobile wallet adoption. Enhancing the eWallet app security by replacing traditional magnetic stripe cards with chip-enabled cards, this transition has facilitated contactless payment options.
-
Mobile Wallet Market Trends and Digital Transactions
The growing trend of mobile wallets for transactions is a pivotal force shaping the North American digital payment scene.
Consumers are embracing digital wallets as a convenient and efficient way to make payments, leading to the market’s substantial growth.
The North American mobile wallet market size exceeded USD 23 billion in 2019 and is projected to expand at a CAGR of 16% between 2020 and 2026.
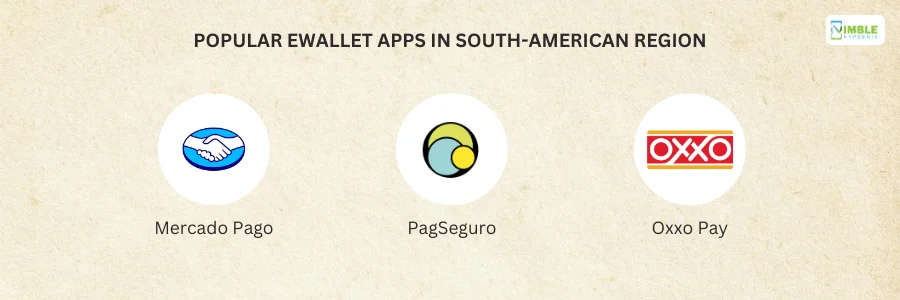
4] South America Region Overview
Latin America’s digital wallet usage statistics show that the rise of mobile wallets is poised to claim a prominent position. This is driven by the booming e-commerce sector and the ever-growing need for seamless, secure payments.
-
Latin America Have 3rd Highest Mobile Wallet User Base
Forbes report predicts that Latin America is set to claim the third spot among regions with the highest mobile wallet users. This ascent signifies a transformative shift, with mobile wallets emerging as the preferred financial instrument in the region.
-
E-Commerce Catalyst: Driving the Online Wallets Market
A key force propelling the online wallet market in Latin America is the exponential growth of the e-commerce sector. As online shopping becomes ingrained in consumer behavior, the demand for convenient and secure payment solutions has surged.
E-wallets, offering a seamless and efficient payment experience, have become the go-to choice for e-commerce platforms, Fintech Apps, and discerning customers alike.
-
POS Payment From Digital Wallet, 31%
In 2022, cash reigned supreme in Latin American POS payments, claiming a substantial 31% of transactions. Digital wallets, while making strides, captured 15%, showcasing the prevalence of traditional cash transactions.
However, the ascent of digital wallets hints at a shifting landscape as they gain momentum.
-
35% eWallet Transaction & Online Payments
Online transactions in 2022 saw credit cards take the lead in Latin America, commanding 35% of transactions. Digital wallets, though trailing at 21%, posed a formidable challenge, bridging the gap with a 67% capture.
This competitive dynamic underscores the digital wallet’s growing influence in the online payment sphere.
-
By 2026, 24% Surge in POS Transactions, 28% in Online Transactions
Looking forward to 2026, a surge is predicted for digital wallets in Latin America. Anticipated to reach 24% in POS transactions and 28% in online transactions, it is poised to become the second most popular payment method in both channels. This trajectory solidifies digital wallets as a rising star, challenging traditional payment methods.
Factors Propelling Digital Wallet Growth in South America:
-
Soaring Smartphone Penetration
The South American digital landscape is experiencing explosive growth, with smartphone penetration surpassing 60% in most countries.
This widespread device accessibility fuels the adoption of mobile-based solutions like digital wallets, making them readily available and user-friendly for the majority of the population.
-
Unbanked Population Seeking Financial Inclusion
A significant portion of the South American population remains unbanked, lacking access to traditional financial services.
Digital wallet apps offer a gateway to financial inclusion, allowing individuals to store and manage money electronically, receive remittances, and even access microloans, promoting financial autonomy and participation in the formal economy.
-
Government Pushes for Cashless Societies
Several South American governments are actively promoting cashless transactions to increase transparency, reduce tax evasion, and improve financial security.
Initiatives like tax incentives for digital payments and subsidies for smartphone purchases further propel the digital wallet’s appeal and incentivize wider adoption.
-
E-commerce Boom and Convenience
The exponential growth of e-commerce platforms in South America has created a natural demand for seamless and secure online payment solutions.
Digital wallets, with their one-click checkout options and integration with major e-commerce platforms, provide a frictionless shopping experience, boosting their popularity among online consumers.
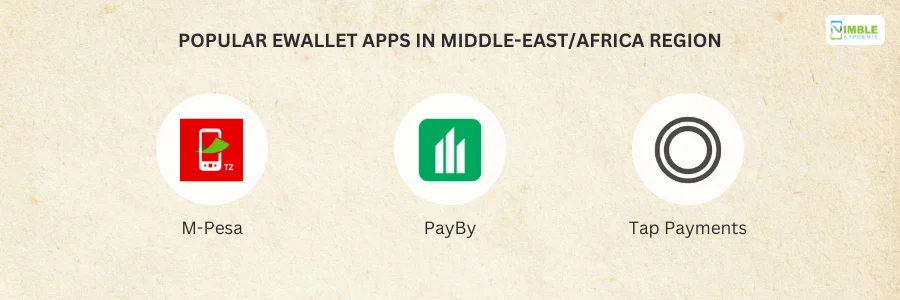
5] Middle-East/Africa Region Overview
Coming to the Middle East and Africa eWallet market (MEA) is experiencing a rapid surge, challenging traditional payment methods and paving the way for financial inclusion.
Digital wallet statistics show the region is going through a dynamic transformation, and the ascendancy of digital wallets is fueled by factors such as increasing smartphone penetration and growing demand for financial inclusion.
-
43% POS Usage from eWallet Apps
The year 2022 witnessed cash reigning supreme in MEA’s POS payments, commanding a formidable 43%. In contrast, digital wallets, though making strides, captured 13%, indicating the continued dominance of cash transactions. However, the ascent of digital wallets signifies a changing landscape.
-
31% of All Digital Wallet Transactions are Towards Online Payments
Online payments in 2022 saw credit cards taking the lead in the MEA region, claiming a significant 31%. Digital wallets, though trailing at 20%, have emerged as a contender, challenging the established credit card dominance.
This competitive dynamic signals a shift in preferences for online transactions.
-
27% In Online Transactions and 24% In POS Transactions Increase by 2026
Peering into 2026, a transformative surge is anticipated for digital wallets in MEA. Predicted to reach 27% of online transactions and 24% of POS transactions, digital wallets are set to reshape the payment landscape.
This projection underscores their increasing influence and acceptance as a preferred payment method.
Factors Driving MEA Digital Wallet Growth:
-
Smartphone Penetration Power
A key catalyst for the digital wallet surge in the MEA region is the increasing penetration of smartphones. As smartphone ownership rises, more individuals gain access to the technology necessary for utilizing virtual wallets.
Smartphones act as a versatile platform, empowering users to manage payment applications and conduct secure transactions anytime, anywhere.
-
Financial Inclusion Imperative
Financial inclusion has emerged as another vital force propelling electronic wallets in the MEA region. In underserved or remote areas where traditional banking services are scarce, digital wallets bridge the gap.
Enabling individuals to conduct financial transactions, receive funds, and access basic banking services, these financial literacy apps play a pivotal role in expanding financial inclusion efforts across the region.
Other Digital Payment App Statistics
In this section of the blog, we shall be looking at some common eWallet app challenges and the technology companies are using to solve them.
So, let’s look at some of the emerging technologies in this niche of fintech app development.
A] BNPL – Buy Now, Pay Later
The rapid expansion of Buy Now, Pay Later (BNPL) app solutions is undeniable, as reported by the Consumer Protection Financial Bureau.
Between 2019 and 2021, BNPL loans from five major lenders witnessed an extraordinary growth rate exceeding 970%.
This substantial surge underscores the increasing popularity and adoption of BNPL apps like Klarna, reflecting a significant shift in consumer preferences toward alternative payment methods.
The popularity of cash advance apps is a good reason why it’s important to include this functionality in modern e-wallet apps.
Speaking of which, the impressive growth in buy now pay later statistics highlights the rising demand for flexible and convenient payment solutions, reshaping the dynamics of consumer financing and signaling a transformative trend in the eWallet landscape.
B] Social Commerce
The staggering projection that revenue from social commerce will exceed six trillion dollars by 2030 signals an unprecedented surge in the integration of commerce and social platforms.
While in 2021, Worldpay’s estimates revealed that digital and mobile wallet payments comprised a substantial 49% of global online transactions, digital wallet industry statistics forecast an increase to 53% by 2024.
Notably, online wallets dominated the market share in the Asia-Pacific Region, commanding around 69% of all e-commerce payments. Anticipating significant growth, the Middle East, Africa, and Latin America are poised to witness the highest surge in mobile wallet market share online by 2024.
These eWallet statistics from Statista show the transformative impact of digital and mobile wallets in shaping the future landscape of global online transactions, particularly in the flourishing realms of social commerce and e-commerce.
C] CryptoWallet
The integration of cryptocurrency wallets and crypto wallet app development has become a prominent trend in the eWallet app niche, fueled by significant user growth.
In 2022, Blockchain.com reported 81 million unique wallets, a 22.3% increase from 2021 and a remarkable 98% surge from 2019.
The surge aligns with a broader trend, as 17% of Americans have engaged with cryptocurrency, and 69% of current cryptocurrency users hold digital assets. Crypto wallet statistics show increasing demand for versatile financial platforms that seamlessly combine traditional and digital currencies.
Integrating crypto wallets into eWallet apps not only accommodates the rising interest in cryptocurrencies but also reflects a strategic move to offer users a comprehensive and unified financial experience. This is what makes it one of the top eWallet app ideas.
As the crypto market continues to expand, the integration of crypto-wallets into eWallets is becoming a standard feature, enhancing the appeal of these applications for users seeking a holistic approach to managing their financial portfolios.
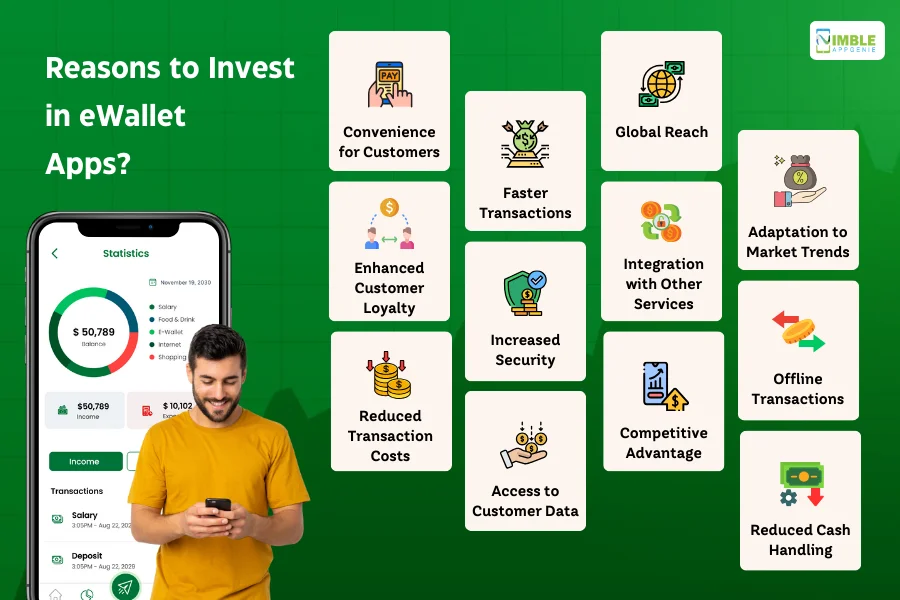
Should You Invest in eWallet Apps?
Yes, you should invest in eWallet apps, as the growing market of the apps indicates that people are more inclined to switch to digital wallets for performing transactions.
Here is the complete list of reasons stating why you should invest in eWallet apps:
Here are the reasons why you should invest in apps:
- Convenience for Customers
- Enhanced Customer Loyalty
- Reduced Transaction Costs
- Faster Transactions
- Increased Security
- Access to Customer Data
- Global Reach
- Integration with Other Services
- Competitive Advantage
- Adaptation to Market Trends
- Offline Transactions
- Reduced Cash Handling
And a lot more.
Speaking of building an eWallet app, this brings us to the next point.

How Can Nimble AppGenie Help You?
Are you inspired by these digital wallet statistics to create your own digital wallet? Don’t worry, we’ve got you covered.
Nimble AppGenie, a renowned digital wallet app development company, is here to help you. So, in a market where everyone claims to be the best, what makes us the right fit for your next project?
There are many reasons, but first, we have worked on more than 700 projects across different industries, including these digital payment masterpieces:
- Pay By Check – Ewallet Mobile App
- SatPay – Ewallet Platform
- CUT–E-Wallet Mobile App
- SatBorsa – A Currency Exchange Fintech App
Amazing, right?
In addition to this, we have been recognized by top platforms like Clutch.co, TopDevelopers, DesignRush, and many more. Our clients vouch for our prowess.
If you want to create a digital wallet platform. Hire mobile app developers at Nimble AppGenie within 24 hours of the request and turn your idea into reality.
Conclusion
Digital Wallet statistics show a surge in the market across the world as well as in specific areas. In this blog, we have discussed all that you need to know about the statistical landscape of the digital wallet niche.
Now, it’s time for you to adapt, create, or grow your platform based on these digital wallet statistics and become the next market leader.
FAQs
As of 2022, cash remains the dominant form of payment, especially in regions like the Middle East and Africa, where it captured 43% of POS transactions. However, digital wallets are on the rise, and by 2026, they are expected to increase their share to 27% of online transactions and 24% of POS transactions in the same region.
According to Statista, the global digital payments market, valued at around $4 trillion in 2020, is expected to exceed $10 trillion by 2026. Juniper Research predicts that the number of digital wallet users will grow from 3.4 billion in 2022 to 5.2 billion globally in 2026, showing a growth of 53%.
The growth of eWallets in MEA is primarily driven by the increasing penetration of smartphones, providing users with the technology to use virtual wallets. Additionally, the demand for financial inclusion, especially in underserved or remote areas without access to traditional banking services, has contributed to the popularity of digital wallets in the region.
Some of the top digital wallet apps globally include Apple Pay, Google Pay, PayPal, Cash App, Venmo, Zelle, Samsung Pay, AliPay, WeChat Pay, and Wise. The popularity of these apps varies by region and user preferences.
Asia-Pacific has a strong preference for digital wallets in both POS and online payments, driven by high smartphone adoption and government support. In contrast, North America exhibits a dominance of credit cards, with digital wallets gaining ground. Latin America sees a surge in mobile wallet usage, especially in the context of e-commerce growth.
The projected transaction volume per user by 2028 varies by region. For instance, North America is expected to reach $8,566 per user, while Africa & the Middle East are anticipated to have a transaction volume of $823 per user.
The growth of digital wallets in Europe is fueled by the widespread adoption of payments and the integration of payment features into mobile banking apps. Offering speed and convenience, have become popular among Europeans, contributing to the growth of digital wallets.
There is a clear generational divide in digital wallet adoption. Younger demographics, aged 18 to 40, show higher adoption rates, with 69.3% of Americans aged 18 to 25 and 73.7% of those aged 26 to 40 embrace digital wallets. In contrast, only 30% of those over 57 have joined this digital payment ensemble.
Juniper Research predicts a surge in digital wallet transactions from $9 trillion in 2023 to over $16 trillion by 2028, showcasing a transformative evolution in global financial dynamics.
Indeed, the BNPL sector has experienced remarkable growth, with loans from the five primary lenders growing more than 970% from 2019 to 2021. Social commerce revenue is also expected to surpass six trillion dollars by 2030, reflecting the increasing integration of financial transactions with social media platforms.

Niketan Sharma, CTO, Nimble AppGenie, is a tech enthusiast with more than a decade of experience in delivering high-value solutions that allow a brand to penetrate the market easily. With a strong hold on mobile app development, he is actively working to help businesses identify the potential of digital transformation by sharing insightful statistics, guides & blogs.
Table of Contents


No Comments
Comments are closed.