 Banking Software Development
 Payroll Software Development
 Our Work Process
 Awards


Are you looking for the world of iOS memory leaks and tools to identify and mitigate them, you have come to the right place.
In Today’s interconnected digital landscape, the security and privacy of user data have become paramount concerns.
Alone in the App Store, there are 1.96 m apps available for download. It’s very crucial to take the app to the app store as Apple has rigid app store guidelines. On the other hand the main concern related to iOS development is iOS memory leaks.
As an iOS developer or enthusiast, understanding the concept of leaks and learning how to detect and address them is crucial to ensuring the integrity of your applications and safeguarding user information.
As Per Apple, a memory leak is:
Memory leak occurs when the memory that was allocated by the app is not released, even though it is no longer referenced or needed. As a result, the memory remains occupied and unavailable for reuse, leading to inefficient memory usage.”
With this in mind, let’s dive into the blog to learn more about iOS memory leaks and how developers can detect and rectify the issues related to them.
Why it is important to address iOS memory leaks?
- Memory leaks increase the app’s footprint. When the app reaches a certain threshold, the operating system triggers a memory warning. If developers do not handle the memory warning properly, it can cause the app to crash, resulting in an Out of Memory (OOM) crash.
- It can affect the user experience negatively. When leaks lead to performance issues or crashes it can frustrate users and drive them away from the app.
- By addressing memory leaks, you can optimize resource usage & help improve the battery life of the device running your app.
What is an iOS memory leak?

An iOS memory leak is a situation where memory that an application is no longer needed is unintentionally retained or not properly released, resulting in memory leak.
It is obvious, that memory leaks can have detrimental effects on the performance and stability of iOS applications. As the leaked memory continues to accumulate, it consumes valuable system resources, leading to increased memory usage and reduced responsiveness.
Memory management in iOS is primarily handled by Automatic Reference Counting (ARC), which automatically tracks and manages object references, ensuring proper memory deallocation.”
In severe cases, excessive memory leaks can cause the application to crash or result in significant performance degradation.
Users’ expectations are very high when it comes to performance. Picture this: If your customers are paying bills and suddenly that app get crashed.
First of all, this is not what they expect, and the now worst-case scenario is they couldn’t pay the bill. This is why while dealing with iOS memory management, it’s very important to be careful with memory leaks.
To understand memory leaks, first, you need to understand how memory management works on iOS through the Automatic Reference Counting (ARC) mechanism.
What is memory management in iOS?
In iOS memory management is primarily handled by ARC a mechanism introduced by Apple to automate memory management.
ARC automatically tracks and manages the references to objects, determining when memory can be safely deallocated. It uses a reference counting system where objects keep track of the number of references to them. And memory is automatically released when there are no more references.
Avoiding strong reference cycles, commonly known as retain cycles, is essential to prevent memory leaks in iOS app development.
However, recognizing potential problems with weak and strong references is relatively easy to fix, but can be hard to spot. This is where the retain cycles come in.
The retain cycles are one of the most common problems that can cause memory leaks in your apps.
Retain Cycle
Now, simply the retain cycle occurs when two objects are strongly dependent on each other. In simple terms, first object count cannot be zero until the second object is released. Similarly, the second object count cannot be released until the first object is zero.
This creates a cycle where each object is needlessly retained because of the inherent reference count of the other resulting in a retain cycle.
To break the retain cycle, both objects need to establish a way to go out independently. By removing the dependency on each other the cycle gets breaks.
Similarly, in iOS, breaking a retain cycle involves breaking the strong reference between the two objects. This can be achieved by using weak or unowned references which do not increase the reference count and allow the object to be deallocated independently.
By breaking the retain cycle, objects can be released and deallocated properly when they are no longer needed, preventing memory leaks and optimizing memory management in iOS applications.
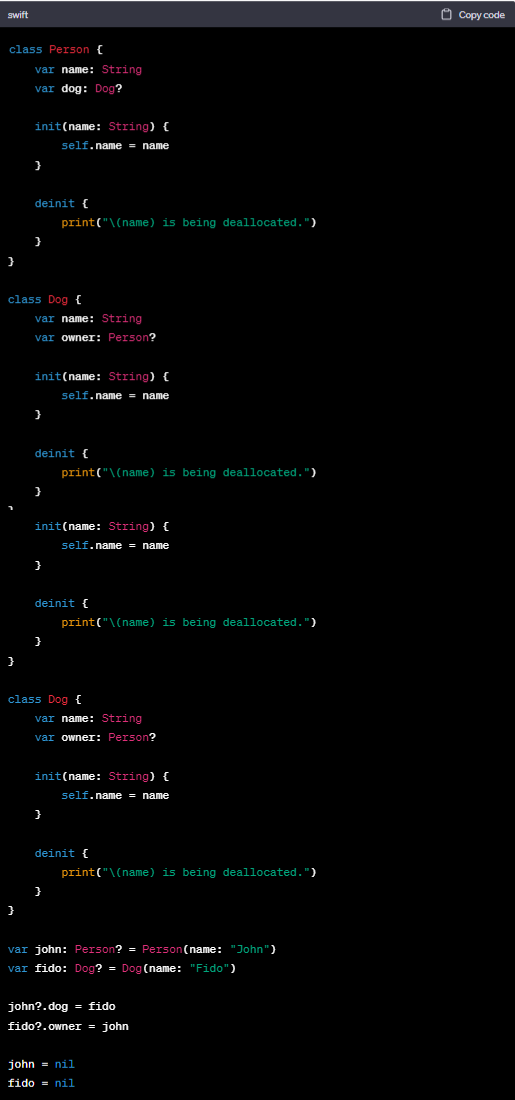
In this code example:
we have a Person class and a Dog class. The Person class has a property dog to represent a dog owned by the person, and the Dog class has a property owner to represent the owner of the dog.
By assigning John to a person and Fido to dog, we create a retain cycle. The Person object (john) holds a strong reference to the Dog object (fido) through the dog property, and the Dog object (fido) holds a strong reference to the Person object (john) through the owner property. As a result, neither object can be deallocated because they keep each other “alive” by maintaining their reference counts.
In this case, when we set John and Fido to nil to remove the strong references, the deinit methods of both classes won’t be called. This indicates that the objects were not deallocated properly due to the retain cycle.
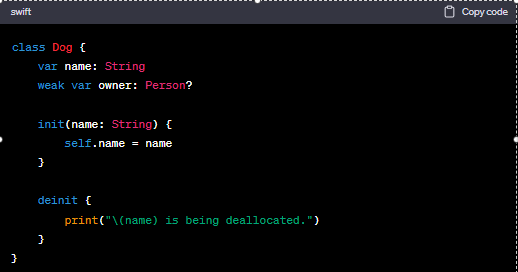
To break the retain cycle, we can introduce a weak reference in either the Person or Dog class. For example, we can modify the owner property in the Dog class to be weak:
How to detect memory leaks in an iOS app?
IOS memory leak detection can be challenging, but several techniques and tools can be used to identify and diagnose memory leaks.
Before you dive into the process let’s take a look at how to create an iOS developer account.
Here’s a step-by-step approach you can follow:
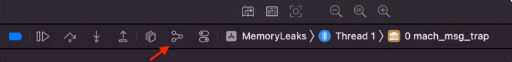
Enable the Memory Graph Debugger:
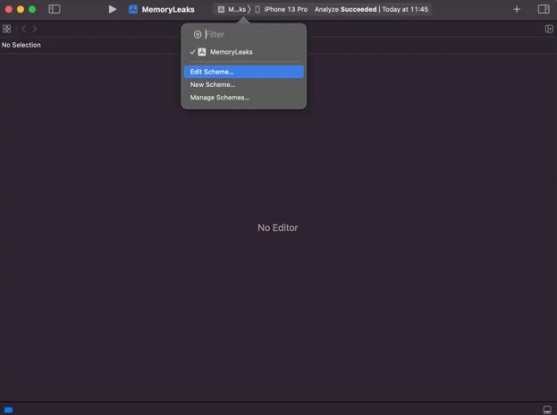
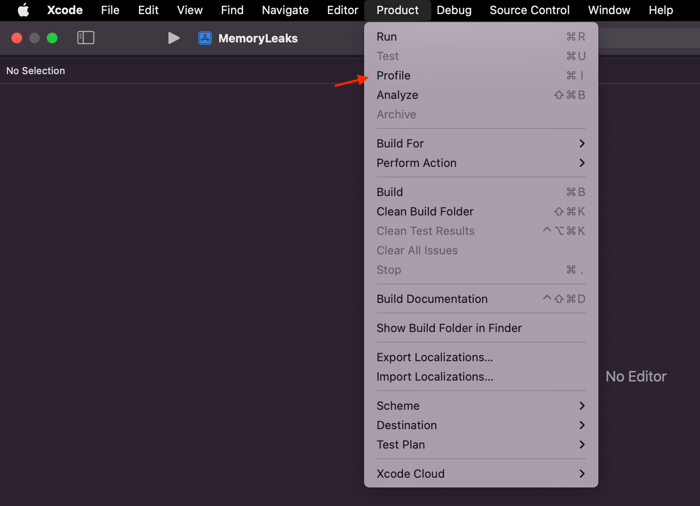
Xcode is the powerful iOS development tool called the memory graph debugger in Xcode 9, which helps you visualize and track memory allocation and deallocations. To enable it, go to the scheme settings for your app (Product-> Scheme->Edit Scheme), select the “Run” phase, and under the “Diagnostics” tab, check the “Memory Graph Debugger” option.
Click on the ‘Run’ scheme and then select the diagnostics section. In this section, two setting has to be enabled. First is Malloc Scribble in the memory management group:
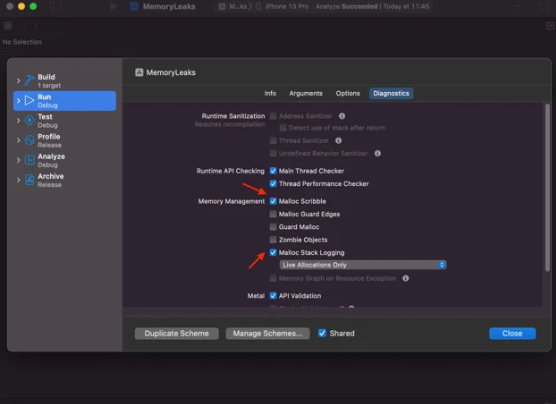
Enabling “malloc Scribble” fills freed memory with a predefined value, making it more evident when memory is leaked.
This improved Xcode’s accuracy in identifying leaks. Enabling “Malloc Stack” in the logging group allows Xcode to create an allocation backtrace, helping you identify the source of object references. These settings provide valuable assistance in detecting and understanding memory leaks in your iOS app.
With this, the memory application graphs get loaded. Next, select the Debug tab in the Xcode navigator pane. It will show you the list of all objects in the memory:
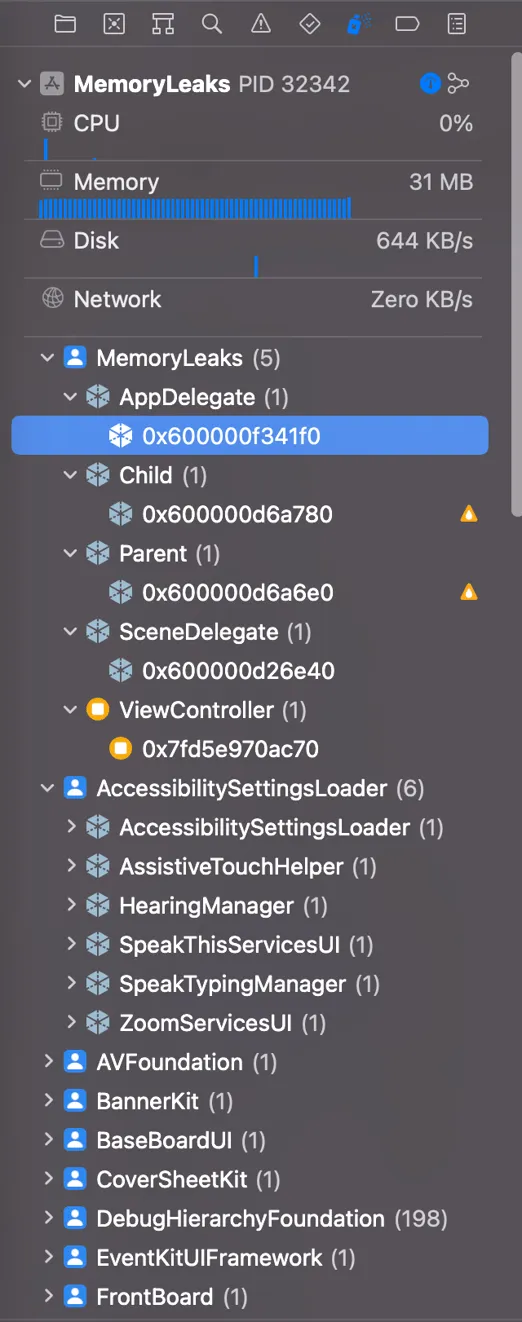
By clicking on the instances in the debug navigator, it will show a relationship graph. This proves invaluable in comprehending active references and tracking down their creation points.
However, these are very helpful in tracking down where references are created and are still being held.
Don’t completely rely on the Xcode as it is not always 100% accurate in identifying memory leaks. After finishing debugging, don’t forget to turn off the Malloc Scribble and MallocStackLogging settings in the run scheme. As it will directly affect the performance of your app.
Instruments tool
During application runtime instruments tools can detect memory leaks. Once the application is launched, you can view real-time resource consumption on the allocations line and instantly check for any memory leaks indicated on the leak line.
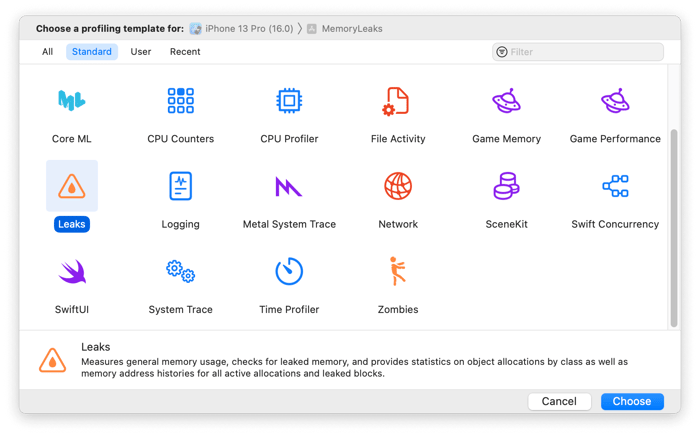
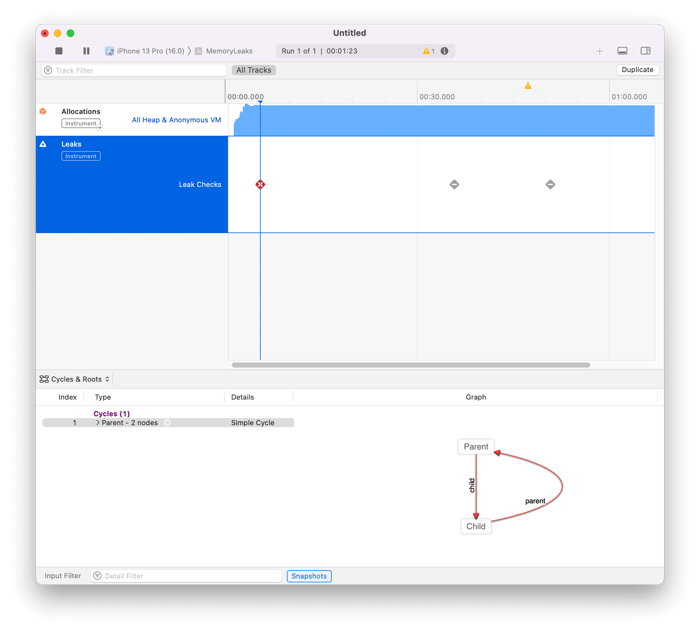
If memory leaks are detected, you’ll receive detailed information, including a stack trace. And, in some cases a memory graph that visually illustrates the retain cycle formation.
The app can track runtime on both simulators and physical devices.
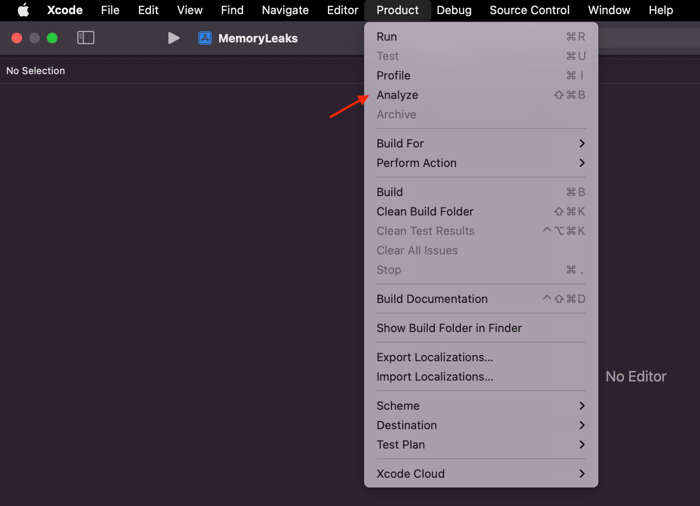
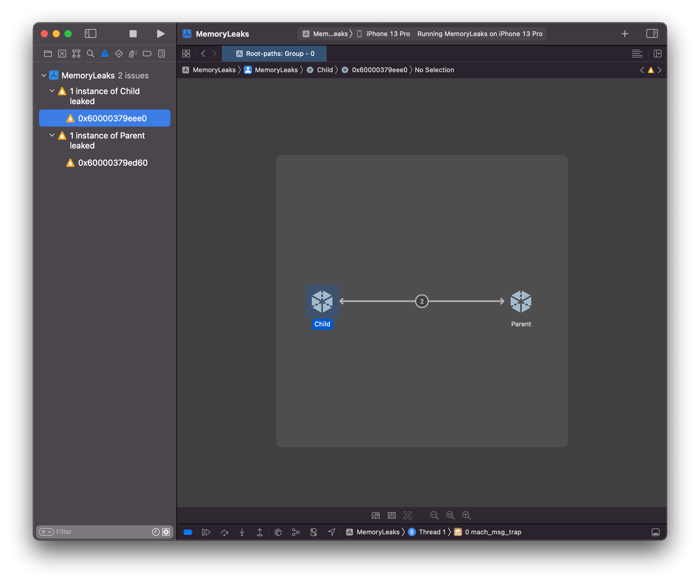
Using the analyze tool
This tool of Xcode performs a static code analysis to identify potential memory leaks. After running the analysis, developers receive a list of suspicious code locations that may be causing memory issues.
Memory graphs, instruments and analyze tools work in synergy, allowing you to use them together for effective memory leak detection.
These tools operate swiftly, enabling immediate debugging when you suspect a memory leak in your application.
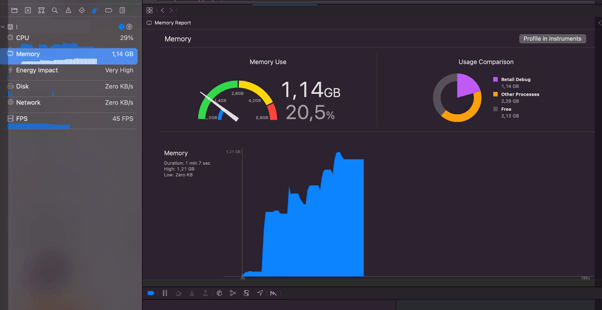
The image above exhibits a clear indication of a memory leak. It illustrates the entry and exit of an ARC view. Where the memory should be released upon exit and not consumed at the same level upon re-entry.
Notably, the resources in the image form a distinct pyramid pattern, persisting without deallocation.
How to solve memory leak in ios?
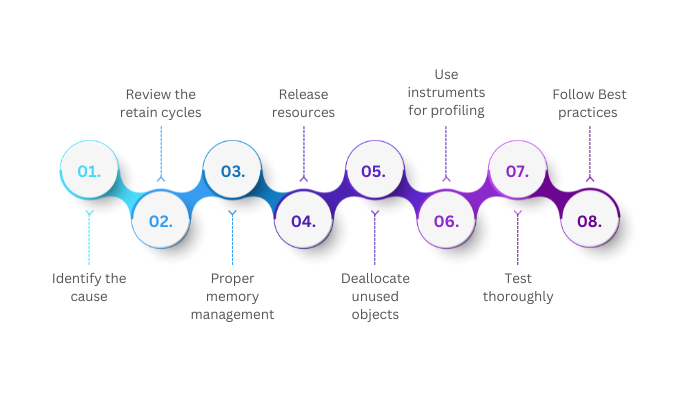
We have already discussed how memory leaks can affect the overall performance of the app. To solve memory leaks in iOS, you can follow these steps:
Identify the cause
Use tools like instruments, especially the leaks instrument, to identify memory leaks in your app. Analyze the detected leaks to determine which parts of your code are causing the issue.
Review the retain cycles
Check for strong references cycle (retain cycles) between objects, as they can prevent proper deallocation. Use weak or unowned references, or break the cycles using capture lists or weak/ unowned self.
Proper memory management
Ensure that you are following proper memory management practices. Use automatic references counting ARC to manage memory automatically. Make sure to retain and release objects correctly and avoid over-retaining or under-releasing objects.
Release resources
Remember to release any resources you’ve acquired such as file handles or network connections. When they are no longer needed, failing to release resources can result in memory leaks.
Deallocate unused objects
Properly deallocate objects when they are no longer required. Set strong references to nil or use weak references for objects that should be deallocated.
Use instruments for profiling
Utilize the instruments to profile your app’s memory usage and identify areas where memory is not being released.
Test thoroughly
Conduct testing, including stress testing, to simulate real-world usage and identify memory-related issues. Moreover, testing frameworks simulate different scenarios to ensure that memory leaks have been resolved.
Follow Best practices
Follow Apple’s guidelines and best practices for memory management in iOS development. Stay updated with the latest documentation and WWDC sessions to leverage the recommended techniques for resolving memory leaks.
After solving a daunting task, there is one more left to conquer as submitting the app to the app store is not an easy feat. Here is the guideline that helps you in submitting your app to the app store.
General practices we follow at Nimble AppGenie to avoid memory leaks
- As an expert iOS app development company, we have strong and clean code for your projects. From time to time code reviews help us.
- We leverage Automatic Reference Counting (ARC), the default memory management system in modern iOS development.
- Use weak references, especially when dealing with delegate patterns or potentially creating strong reference cycles. Weak references help break these cycles and prevent memory leaks.
- We utilize Instruments, a powerful tool in Xcode, to profile our apps and detect any memory leaks or abnormal memory usage.
Conclusion
As we have outlined above, it’s very clear that ARC does an amazing job in managing memory leaks in iOS apps. And breaking the retain cycle will do the best.
Moreover, instruments and memory graph debuggers will do the rest in catching issues early and often. I hope with this blog you get the right information and help you in solving your issues with the iOS memory leaks. Before you invest in iOS development it is recommended to consult the cost to develop an iOS.
FAQs
iOS leaks can impact app performance, stability, and user experience. They can lead to increased memory consumption, app crashes, and reduced device battery life. Addressing leaks helps maintain optimal app performance.
You can use various tools and techniques to detect iOS leaks, such as Instruments in Xcode. Running your app with the Leaks instrument can help identify memory leaks. Additionally, static code analysis with the Analyze tool can catch potential memory issues.
Signs of iOS leaks include increasing memory usage over time, app slowdowns or crashes, and unusually high resource consumption. Monitoring memory growth during app usage can help identify potential leaks.
Instruments, a tool in Xcode, provides the Leaks instrument to identify memory leaks. By profiling your app with the Leaks instrument enabled you can analyze detected leaks and review stack traces to pinpoint the source of the leaks.
Yes, there are several best practices to prevent iOS leaks. These include using Automatic Reference Counting (ARC), avoiding strong reference cycles (retain cycles), properly releasing resources, and thorough testing and profiling of your app.
Not addressing iOS leaks can lead to app instability, crashes, poor user experience, and negative user reviews. Additionally, memory leaks can impact device performance and battery life.

Niketan Sharma, CTO, Nimble AppGenie, is a tech enthusiast with more than a decade of experience in delivering high-value solutions that allow a brand to penetrate the market easily. With a strong hold on mobile app development, he is actively working to help businesses identify the potential of digital transformation by sharing insightful statistics, guides & blogs.
Table of Contents


No Comments
Comments are closed.