In a Nutshell:
- Real estate market statistics confirm steady global expansion driven mainly by residential and urban development.
- Residential real estate holds the largest share of global market value.
- Asia Pacific leads the global real estate market, while the United States remains the largest single country market by total asset value.
- Rental properties generate more revenue than sales, mainly due to rising home prices.
- Digital platforms are now central to property discovery, and these real estate market statistics highlight the rising importance of real estate apps.
The real estate market has seen a major boom in recent years. In fact, most buyers, sellers, and renters start their journey on a mobile app. Real estate mobile apps have become the first touchpoint for property discovery worldwide.
From searching homes to checking prices, comparing areas, and contacting agents, everything now happens on mobile applications. Due to this shift, the real estate app market has seen steady growth globally.
Startups, enterprises, and investors are paying close attention to market size, revenue, and user growth before investing in real estate app development.
Therefore, in this blog, we will cover the in-depth real estate market statistics, including global data and country-wise insights for the US, India, and China.
Global Real Estate Market Size and Growth Statistics
The worldwide real estate market is one of the largest markets in the world in terms of value and long-term importance.
Let’s deeply check out the statistics of the real estate industry:
- The worldwide market size of the real estate industry is forecasted to hit an amazing value of $5,852.02 billion by 2030. This means the market is projected to add more than $1.7 trillion in value over six years.
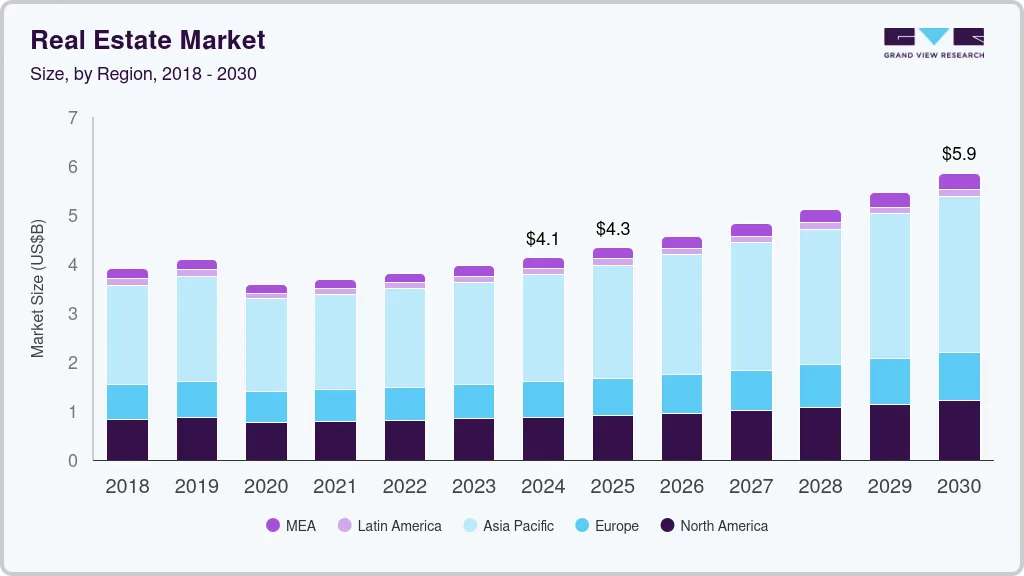
- From 2025 to 2030, the real estate market is forecast to grow at a compound annual growth rate of 6.2%. This growth rate shows that the market is expanding consistently rather than in sudden spikes.
- The residential real estate segment dominates the market with a forecasted volume of $551.24 trillion by 2026.
- In the worldwide context, it is estimated that the USA is going to generate the highest number in the real estate market, which is $141.3 trillion by 2026.
There are multiple factors that are supporting this exponential growth. One of the biggest drivers is population. As the global popularity increases, the demand for housing also increases.
Also, more and more people need places to live in cities and urban areas. Along with housing, population growth also raises demand for offices, retail spaces, hospitals, schools, and warehouses.
Global Real Estate Market Value at the Asset Level
When you measure the real estate industry by total asset value rather than yearly revenue, the scale of the market becomes really larger. By 2026, the worldwide market size of the real estate industry is anticipated to reach $673.08 trillion.
Within this total value, the residential real estate alone is forecasted to reach $551.24 trillion. This shows that housing remains the most demanding part of the worldwide real estate industry.
• Country-Level Market Value
At the country level, the United States leads the global market. The US real estate market is forecasted to hit $141.3 trillion by 2026. This shows the size of the US housing stock, commercial properties, and long-term investment activity.
Real Estate App Market Statistics by Region
The real estate market growth is not the same everywhere. There are some regions that lead the real estate market because of population size, urban growth, and investment activity. However, others grow really fast due to new development and government support.
Here are the figures that show how different regions are performing:
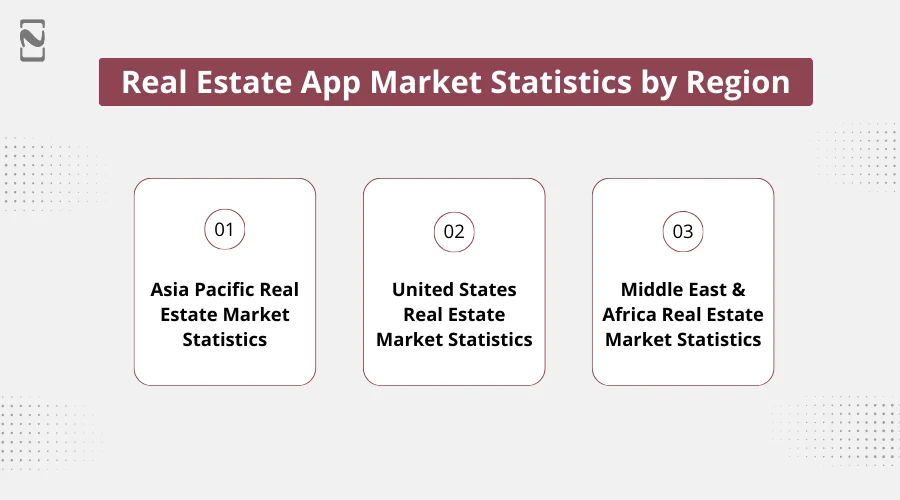
► Asia Pacific Real Estate Market Statistics
Asia Pacific is the largest real estate industry globally. In 2024, the Asia Pacific held 52.8% of the global real estate market share. This means more than half of the world’s real estate activity comes from this region alone.
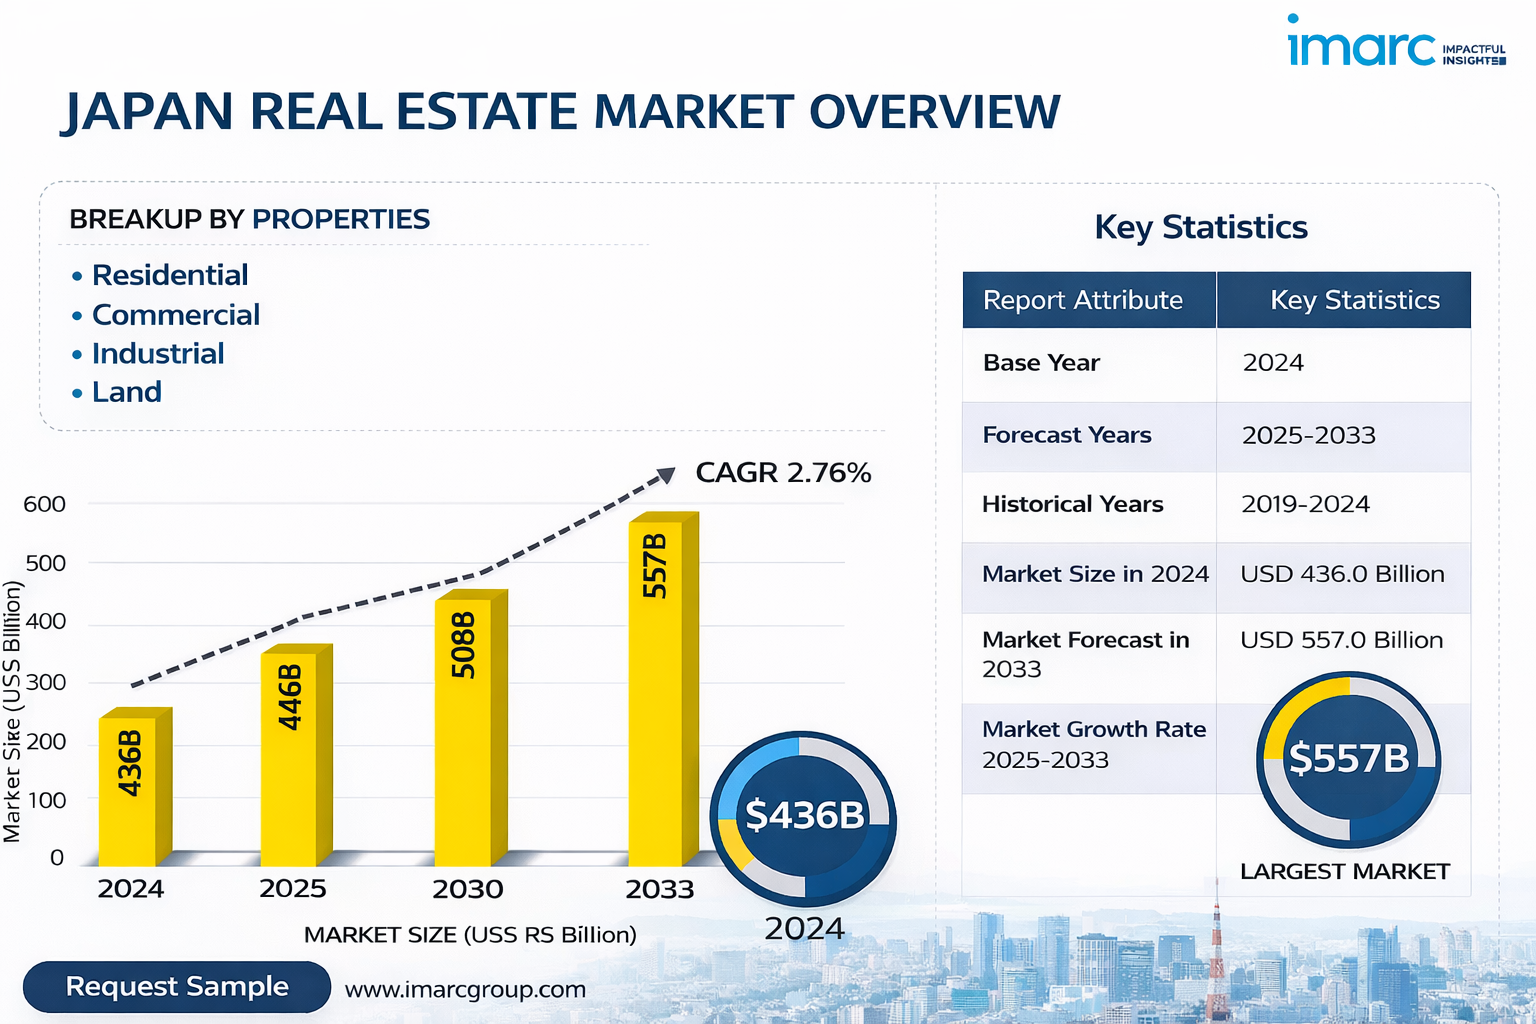
♦ Japan
Japan recorded $9.8 billion in property transactions in Q4 2025. The annual investment in Japan increased by 14% compared to last year. As per IMARC Group, Japan’s real estate market size is projected to reach $557.0 Billion by 2033.
Growth was supported by sales of industrial development projects, including deals by foreign sellers. The office and multifamily properties performed better due to stronger rental growth.
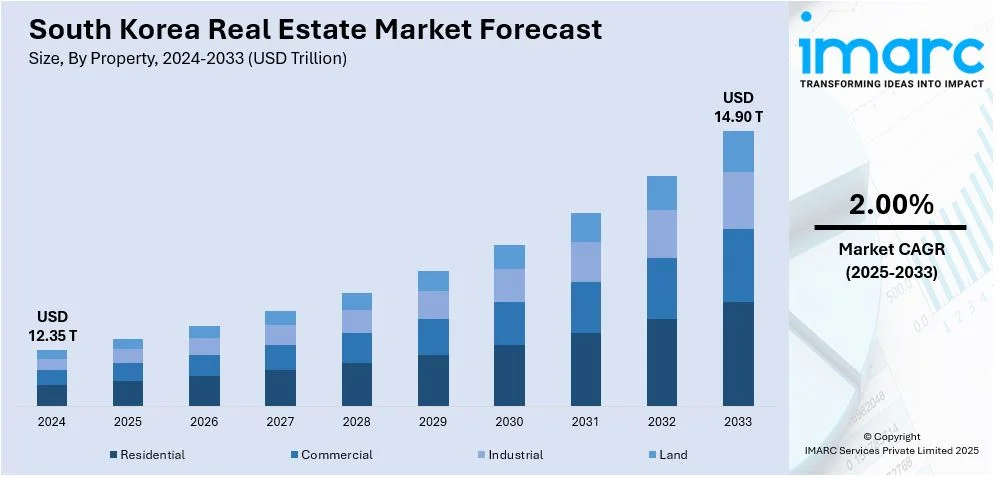
♦ South Korea
South Korea saw $7.7 billion in real estate investment in Q4 2025. This was a 41% increase year-on-year. The market size of South Korea’s real estate market is forecasted to reach $14.90 trillion by 2033.
The domestic investors focused mainly on core office assets. The foreign investors showed strong interest in logistics properties.
♦ India
India is projected to hit $585.09 billion in 2026 and is forecasted to grow to $926.56 billion by 2031. Residential demand remains steady in well-connected areas that benefit from new metro lines and highway developments.
However, rising home prices at the entry level are limiting affordability, which leads some buyers to shift toward renting or consider homes in outer and less central locations.
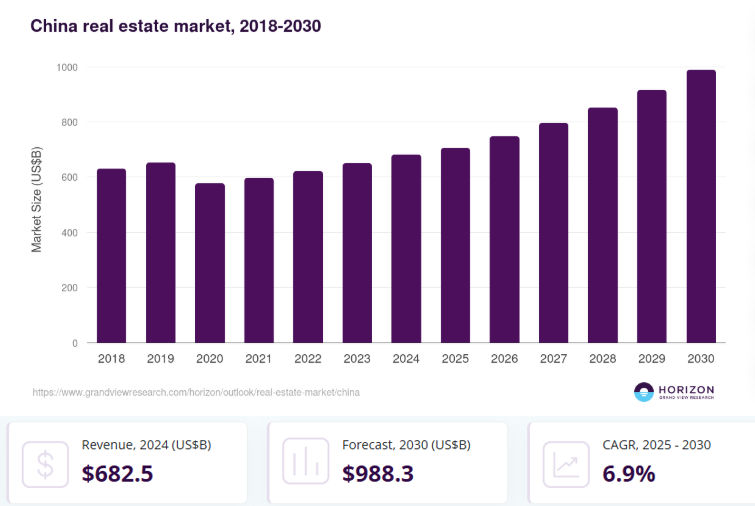
♦ China
China plays the biggest role in the Asia Pacific’s dominance. It accounts for over 65% of the Asia Pacific’s real estate market share. This is mainly due to the large population, rapid urban development, and ongoing demand for residential and commercial properties.
As per GrandViewResearch, the market size of China’s real estate is expected to reach $988 billion by 2030. Urban expansion in developing cities. The growing demand for offices, hotels, and logistics spaces.
Also, it is noted that investment activity is expected to increase by 5% to 10%. This strong activity is expected in Australia, South Korea, and Singapore.
► United States Real Estate Market Statistics
The United States remains one of the most active and valuable real estate markets globally.
Some key US market numbers include:
- 4,090,000 existing homes were sold in 2023.
- New single-family home sales reached 619,000 units (annual rate) in May 2024.
- The US has more than 360,000 real estate brokerage firms.
- There are 5.9 million commercial buildings across the country.
- These buildings cover 97.0 billion square feet of floor space.
- The US has 125.7 million occupied housing units.
The US market is also seeing a shift in demand. The suburban properties are gaining popularity. Also, the remote and hybrid work models are pushing people away from dense city centers.
At the asset level, the US real estate market is projected to reach $141.28 trillion by 2026. This makes the US the single largest real estate market by value.
► Middle East and Africa Real Estate Market Statistics
The Middle East is forecasted to hit $799.46 billion by 2033. The African region is expected to grow faster than many mature markets. It is expected to grow to $332.3 billion by 2033.
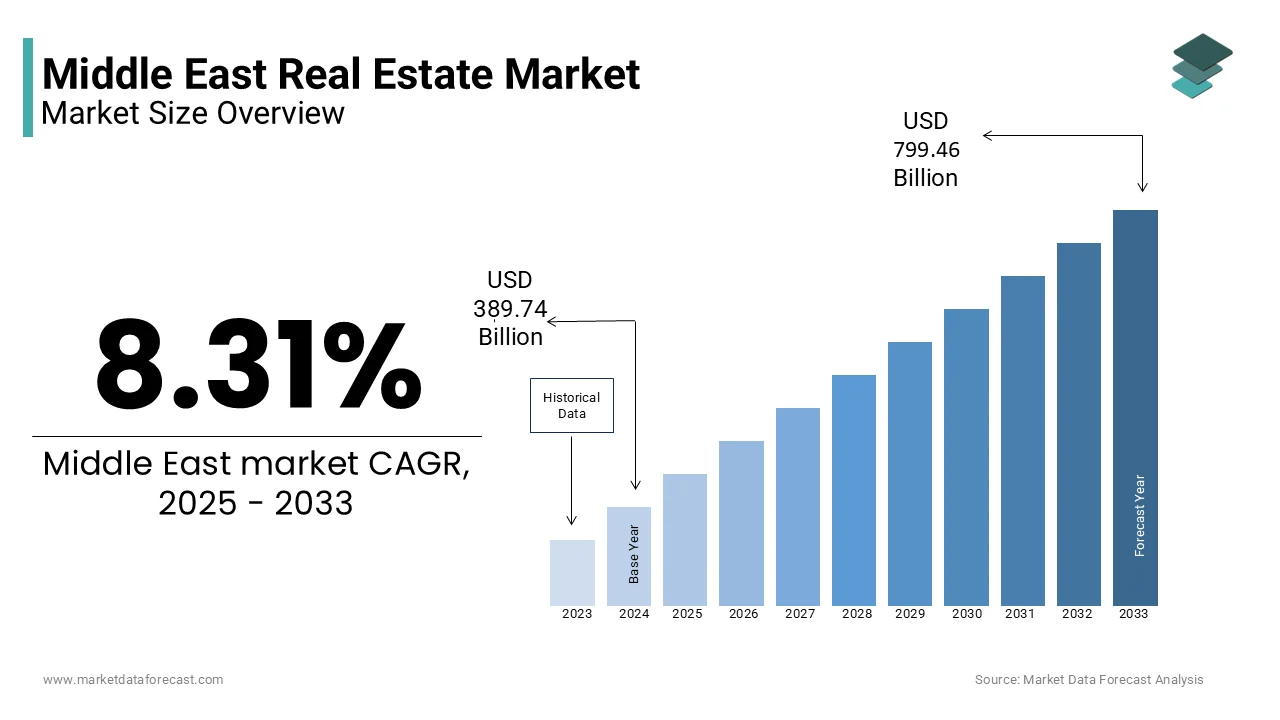
The region is projected to grow at a CAGR of 7.2% from 2025 to 2030. The growth is mainly supported by new residential and commercial projects, strong tourism activity, and large-scale hospitality developments.
A key example of development activity:
- In Q3 2021, the region had 545 hotel projects.
- These projects represented 168,042 hotel rooms.
Countries in this region are also focusing on sustainable buildings, smart city projects, and technology-enabled real estate developments. The projects, such as eco-friendly cities and mixed-use developments, are helping attract both local and international investors.

Residential vs Commercial Real Estate Market Statistics
The real estate market is mainly divided into two large segments: residential and commercial. Each segment behaves differently and is influenced by different demand factors.
The statistics below show how these two segments compare in terms of size, value, and activity.

♦ Residential Real Estate Market Statistics
Residential real estate is the largest segment of the global real estate market. It includes houses, apartments, condominiums, and rental homes. At the global asset level, residential real estate is projected to reach $551.24 trillion by 2026.
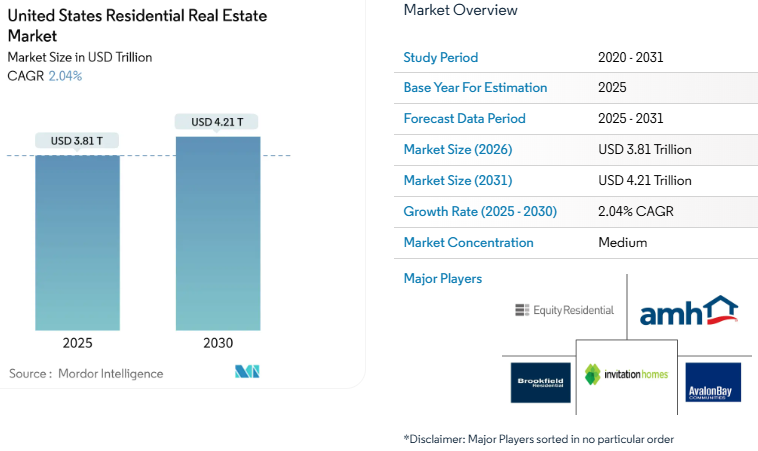
This figure alone shows how important housing is to the overall real estate industry. In the United States, residential activity remains strong. It is estimated at $3.81 trillion in 2026 and will reach $4.21 trillion by 2031.
The major residential housing numbers in the US include:
- 125.7 million occupied housing units.
- 4.09 million existing homes sold in 2023.
- 619,000 new single-family homes sold (annual rate, May 2024).
- Apartments and condominiums recorded around 81.50% revenue in 2025.
These numbers show that buying and selling homes continues even when interest rates are high. So the demand for real estate app development will be on a boom.
♦ Factors Supporting Residential Demand
There are many factors that are keeping residential demand active.
Let’s take a look:
- Population growth and household formation.
- Urban expansion and new housing developments.
- Rising preference for private living space.
- Increased interest in suburban and low-density areas.
People are also looking for homes that support work-from-home needs, which has increased demand for larger residential units.
♦ Commercial Real Estate Market Statistics
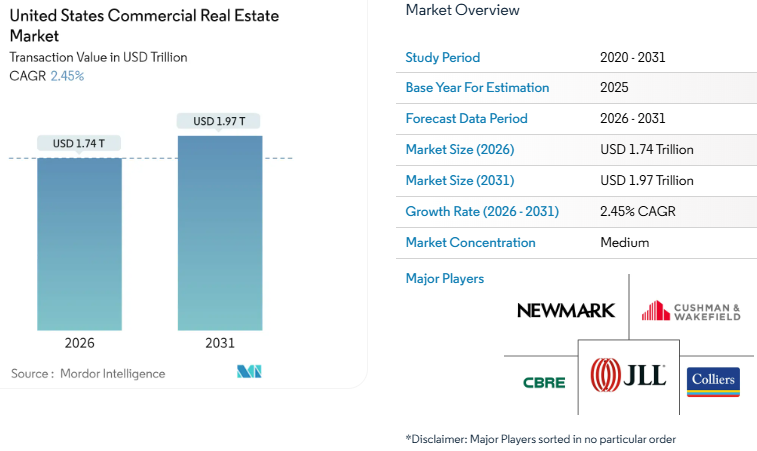
Commercial real estate includes offices, retail spaces, warehouses, industrial buildings, hotels, and mixed-use properties. The United States has estimated that it will be $1.97 trillion by 2031.
It alone has:
- There are 5.9 million commercial buildings.
- These buildings cover 97.0 billion square feet of floor space.
This shows the huge scale of commercial property usage in different industries. Also, the commercial real estate demand is shifting rather than declining.
It is because:
- Office demand is focusing on high-quality and well-located buildings.
- Logistics and warehouse demand remain stable due to e-commerce growth.
- Hospitality projects continue to expand in tourism-driven regions.
In the Middle East and Africa, 545 hotel projects were recorded in Q3 2021. These projects accounted for 168,042 hotel rooms. This data shows continued investment in commercial and tourism-based real estate.
Note: These statistics show that real estate growth is not limited to one type of property. Residential real estate remains the foundation of the market, while commercial real estate adapts to changes in work, travel, and shopping behavior. For developers and investors, understanding these differences helps in choosing the right property type based on demand stability and long-term value.
Rental vs Sales Real Estate Market Statistics
The real estate market can be divided depending on how properties are used. It means rental properties and sales properties.
Both types have unique demand patterns, revenue contributions, and growth trends.

➤ Rental Real Estate Market Statistics
Rental properties are those leased or rented out instead of sold. Rental demand has been rising in many countries, especially where buying homes is expensive or urban living is preferred.
The main rental statistics globally and regionally are mentioned below:
- In 2024, rental-type real estate held 54.5% of the revenue share.
- Rising home prices in developed countries have made renting more popular than buying.
- Remote and hybrid work models increased the demand for rentals. And it is especially in cities with strong digital infrastructure and lifestyle appeal.
For instance, Germany. It is noted that around 60% of properties were rented in 2021. This shows a strong presence for renting over ownership in mature markets.
Data from the 2023 American Community Survey shows that 31% of renters now live in single-family homes. It reflects an increase of 3.5 million renters over the past 20 years.
This shift in the rental market has helped drive a 4.4% year-over-year increase in single-family rental rates as of Q4 2024, supported by strong demand from households choosing to rent instead of buy.
➤ Sales Real Estate Market Statistics
Sales properties mean real estate purchases owned by individuals, investors, or institutions.
The main statistics for sales-based real estate are:
- Sales type is forecasted to grow at a CAGR of 7.3% from 2025 to 2030.
- The rising urban populations and changing lifestyle preferences are increasing property purchases.
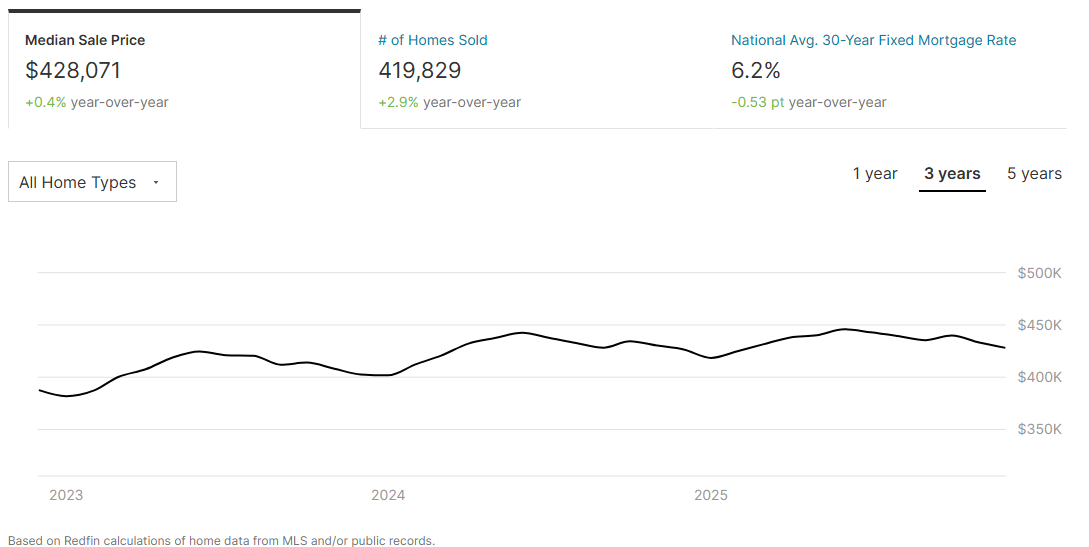
- In the US alone, around 419,829 houses were sold in 2025.
- Homes, luxury villas, and second homes are seeing higher demand due to changing consumer perception about ownership.
For example, India. Between January and September 2021, about 163,000 new residential units were added in the top 7 cities. The government policies like PMAY and RERA have increased affordable housing supply, which helps property sales.
Note: This comparison shows that while rentals dominate revenue share, sales are growing faster in terms of percentage growth. Investors, developers, and policymakers need to balance focus between these two segments to meet different market needs.

Conclusion
The real estate market is rapidly growing worldwide, and the numbers clearly show this trend. Residential real estate remains the largest part of the market, while commercial real estate continues to grow in areas like offices, logistics, and hotels.
Additionally, rental properties are increasing because home prices are high. But property sales are also rising due to urban growth and better infrastructure.
Regions like Asia Pacific, the United States, and emerging markets are leading this growth. These real estate market statistics help founders, investors, and businesses understand where demand is strong and where new opportunities exist.
As more users search, compare, and contact agents through mobile platforms, the need for reliable real estate apps and real estate app development will continue to increase.
FAQs

Niketan Sharma, CTO, Nimble AppGenie, is a tech enthusiast with more than a decade of experience in delivering high-value solutions that allow a brand to penetrate the market easily. With a strong hold on mobile app development, he is actively working to help businesses identify the potential of digital transformation by sharing insightful statistics, guides & blogs.
Table of Contents
No Comments
Comments are closed.