The mobile app market is exploding with potential.

From B2B niches to on-demand, social media, and communication, mobile apps have forever changed how we interact with technology.

This has attracted a lot of people from across the world to look into this market and it’s trillion dollar potential. And that’s all we are going to talk about here.

Mobile app statistics shows us a beautiful landscape of exploding demand, endless potential, and limitless growth. In this statistical insight into app market, everything will be discussed in detail.

Therefore, with this being said, let’s get right into it, starting with a brief overview.

Key Points: Mobile App Statistics

Here are the key takeaway mobile app statistics to be featured at the top of the blog, providing a concise and compelling snapshot of the mobile app industry’s current state and future potential:

  1. Market Size and Growth: The global mobile app market is projected to grow to $756 billion by 2027, expanding at a CAGR of 8.58% during the period 2022-2027.
  2. User Engagement: The average smartphone user interacts with 30 apps per month, with 51% of users checking their apps between one to ten times daily.
  3. Revenue Potential: Mobile app revenues are forecasted to increase significantly, with an estimate of reaching $673 billion by 2027. In 2024 alone, the mobile apps are expected to generate $935 billion in revenue.
  4. Dominant Sectors: Gaming apps are predicted to generate approximately $173.4 billion by 2026, while other lucrative sectors include educational and social media apps.
  5. Consumer Spending: In 2022, iOS app revenues increased by 10.6%, reaching $36.3 billion, underscoring the robust financial health of the app market.
  6. Technological Investment: Significant investments in 5G technology are enhancing network capabilities, paving the way for more advanced and responsive mobile applications.

These statistics underscore the dynamic and rapidly growing nature of the mobile app market, making a compelling case for the timely development of mobile apps in 2024.

CTA 1_Start Your App Journey Today!

Mobile App Industry Statistics

It’s time to look at some important statistics of mobile apps.

The mobile app industry continues to be a major force in the global economy, showing robust growth and offering expansive opportunities for developers and businesses alike.

These industry statistics provide a comprehensive snapshot of the current market landscape, user engagement, and future predictions.

Thus, highlighting the pivotal role of mobile apps in our daily lives and the broader digital economy.

♦ Market Growth and Value

The global mobile app market is on an impressive growth trajectory.

According to mobile app industry statistics, it is estimated to reach $756 billion by 2027, growing at a compound annual growth rate (CAGR) of 8.58% during 2022-2027.

This growth is driven by continuous innovations in mobile technology, increasing smartphone penetration, and evolving user habits that emphasize convenience and efficiency.

♦ User Engagement with Apps

User engagement statistics provide insights into how deeply integrated mobile apps are in the daily routines of consumers.

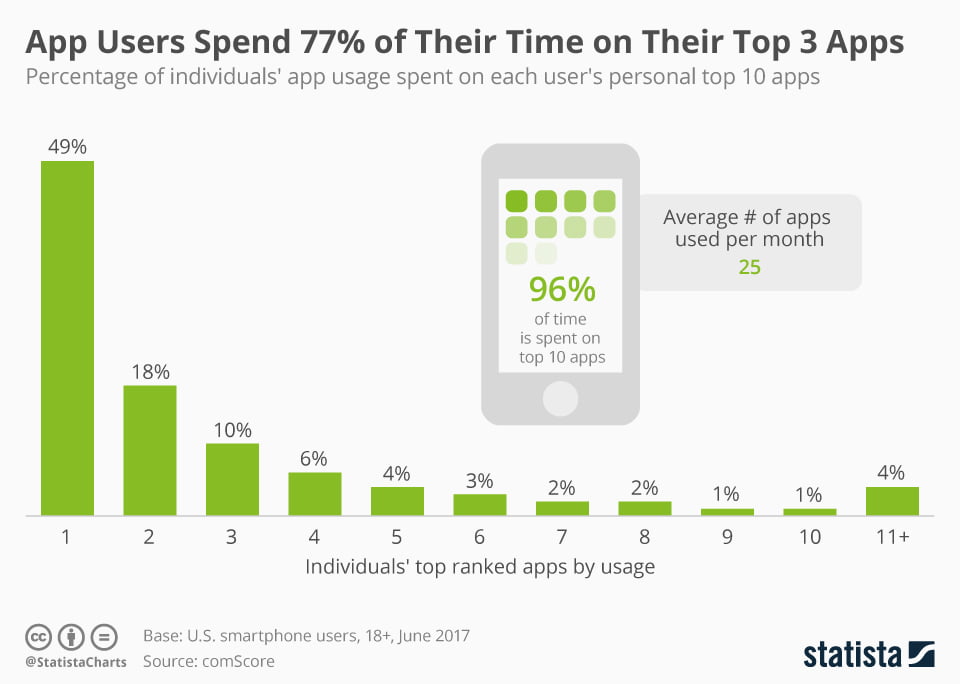
On average, a smartphone user interacts with 30 applications per month, demonstrating the variety and utility of apps in catering to different needs and interests.

In addition, about 51% of smartphone users check their apps between one to ten times daily, highlighting the frequent and habitual use of mobile apps for numerous purposes, from chatting apps to gaming and productivity.

♦ Dominance of Gaming Applications

Gaming applications remain a dominant category within the app market, not just in terms of downloads but also in revenue generation.

It is predicted that by 2026, the revenue from gaming apps will soar to approximately $173.4 billion.

This growth is supported by the ongoing surge in mobile adoption and increasing sophistication of smartphone technology, which enhances the gaming experience for users worldwide.

The popularity of gaming apps reflects broader trends in leisure and entertainment consumption, with mobile games offering an accessible and engaging diversion that appeals to a wide demographic.

Mobile App Revenue Statistics

As the digital economy expands, mobile app revenue statistics offer critical insights for investors, developers, and marketers looking to capitalize on this burgeoning market.

The revenue generated from mobile apps not only demonstrates their economic impact but also highlights consumer spending behaviors and preferences in the digital age.

Understanding these financial dynamics is essential for anyone involved in the mobile app industry.

Here’s a closer examination of the current and projected financial trends in mobile app revenue statistics:

  • The global revenue from mobile apps is experiencing a sharp increase, with projections estimating a rise from $522,717.51 million in 2024 to $673,778.05 million by 2027.
  • Reports by Statista highlight that 50% of web traffic now originates from mobile devices, emphasizing the shift towards mobile internet usage.
  • In 2024, mobile apps are expected to generate an impressive $935 billion in revenue, signaling a lucrative market for app developers and businesses.
  • Recent data suggests that revenue for both the App Store (AS) and Google Play (GP) will grow at a CAGR of 19.5% up to the end of 2025. Revenue figures are expected to be $76 billion for GP and $159 billion for AS in 2024, escalating to $85 billion for GP and $185 billion for AS in 2025.
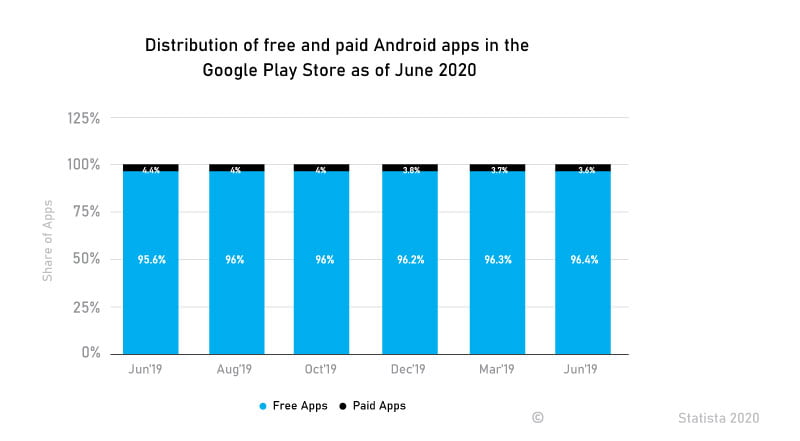
  • An astonishing 98% of mobile app revenue worldwide comes from free applications showcasing the effectiveness of in-app purchases and advertising.
  • The total revenue of mobile apps is anticipated to grow at a CAGR of 9.27% from 2022 to 2026, reaching $614.40 billion by 2026.
  • Uber Technologies, a key player in the mobile app market, initially received $200K in seed funding for app development. Despite this, its mobile app revenue reported less than $5K in February 2024 with “Uber-Request a Ride” as the top-grossing app.
  • By 2025, the app revenue sector is expected to surge, potentially generating about $613 billion.
  • Paid applications, though less dominant, are still forecasted to generate nearly USD 7 billion from app purchases by 2026.

These mobile app revenue statistics illustrate a vibrant and rapidly evolving market.

For businesses and developers, these figures underscore the importance of innovative monetization strategies, particularly for free apps which dominate the market revenue.

As mobile usage continues to rise, tapping into this potential will require continuous adaptation and understanding of market trends and consumer behavior.

This financial overview not only informs strategic decisions but also highlights the immense potential within the mobile app sector for growth and profitability.

♦ Revenue of Apps on the Google Play Store

The Google Play Store has experienced remarkable growth in consumer spending on apps.

In the period between 2021 and 2022, there was a substantial increase of 58.2% in revenue.

However, in 2022, the growth pace moderated to 8.4%, accumulating total revenues of $11.5 billion for the year.

The mobile app statistics highlight the fluctuating yet upward trend in the Android app market, reflecting a dynamic response to consumer demand and market conditions.

♦ Revenue of Apps on the Apple App Store

The Apple App Store continues to outperform expectations, demonstrating robust financial health. In 2022 alone, app revenues on iOS surged by 10.6%, reaching $36.3 billion.

Notably, iOS has carved out a significant niche, contributing to 75% of total consumer spending on apps last year.

This substantial revenue share underscores the lucrative nature of the iOS market and its appeal to app developers and investors aiming for high returns.

This is the reason why iOS app development is more popular than android.

♦ Country-Wise App Revenue Statistics

Global app statistics show that China, Japan, and the USA dominate the mobile app revenue market, securing the largest shares.

These countries are pivotal in driving substantial financial volumes within the app industry.

In addition to this, other nations across various continents are progressively contributing more to global app revenue, expanding the geographical diversity of market players and opportunities in the mobile app sector.Annual App Revenue by region 2016 to 2022

♦ Industry-Wise Revenue of Mobile Apps Worldwide

It goes without saying there are a lot of mobile app categories.

App industry statistics show us that some of them are much more popular than others. Let’s look at which of them are super popular and as well as lesser ones.

That is one of the big reasons why businesses are investing in education app development, social media app development, as well as news & magazine app development.

These niches are giving the most revenue to businesses investing app development project as per statistics.

♦ Revenue of Gaming Apps

Mobile gaming continues to be a powerhouse in the app revenue landscape, claiming the largest share of global mobile app revenue.

App statistics report shows that despite a 9.2% decline in consumer spending on mobile games in 2022, industry leaders remain optimistic about future growth prospects.

It is this revenue from gaming platform that inspire so many clients to develop fantasy sports apps like games.

The sector’s resilience and potential for recovery reflect the enduring popularity and engagement of gaming apps among users worldwide.

These detailed insights into mobile app revenue statistics by platform, region, and app category provide a granular view of market dynamics.

For businesses and developers, understanding these trends is crucial for strategic planning and leveraging opportunities in the high-growth areas of the app market.Top of Form

Mobile App Download Statistics

To be successful among people, a mobile app needs to have a high download rate.

That’s why going through mobile app download statistics becomes so important. In this section of the blog, we shall be going through exactly that.

Mobile App Download Statistics

♦ Global Download Trends

The landscape of mobile app downloads is vast and continuously expanding.

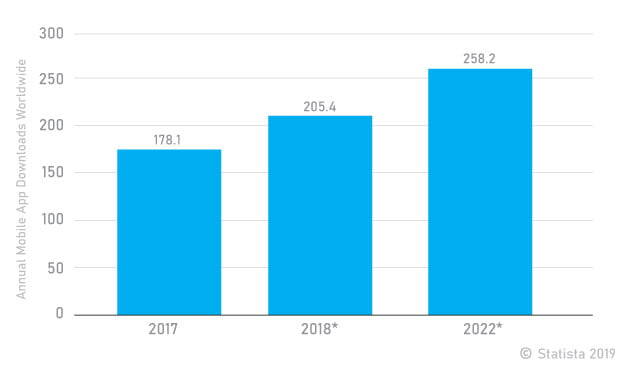
Every year, an astonishing 255 billion mobile applications are downloaded worldwide, demonstrating the ubiquitous nature of mobile technology in modern life.

This immense volume of downloads reflects the integral role apps play in our daily lives, catering to a variety of needs and interests.

♦ App Store and Google Play Performance

A closer look at the major app marketplaces reveals that combined, the Google Play Store and Apple App Store account for about 35-36 billion downloads annually.

This figure highlights the significant market share these platforms hold, driving the bulk of app distribution globally.

♦ Popularity by App Genre

Among the diverse categories of apps, mobile games lead the pack with approximately 100 billion downloads each year, underscoring their dominant position in consumer preferences.

Following this, mobile photo and video apps are the second most popular genre, boasting around 20 billion downloads annually.

This trend illustrates the broad appeal of interactive and multimedia applications among users worldwide.

♦ App Downloads by Country

Statistical reports indicate that China has experienced an 80% growth in the download rate, India has a high 190% download rate, and the United States has just a 5% rate of app download.

Let’s look at app download statistics by countries:

CountryDownloads (Billion)
China98.3
India26.6
USA12.1
Brazil10.3
Indonesia7.3
Russia5.5
Mexico4.8

This mobile app data & statistics highlights significant geographic disparities in mobile app engagement, with China leading by a substantial margin, indicating a vast and highly engaged user base.

♦ Free vs Paid Download Statistics

The dynamic between free and paid apps is a pivotal aspect of the mobile app economy.

A standout statistic reveals that a whopping 98% of mobile app revenue worldwide is sourced from free applications.

This substantial percentage underscores the power of monetization strategies beyond direct purchase, such as in-app purchases and advertising.

It illustrates the shifting consumer preferences towards free apps that offer optional purchases, reshaping how developers strategize their revenue models.

♦ Google Play Store vs iOS App Store Download Statistics

When comparing the two major platforms, there is a notable difference in growth rates.

App download statistics show that the Google Play Store has seen a robust increase in downloads, growing by 31%.

In contrast, the Apple App Store exhibited a more modest growth, with a rate of only 2.5 percent.

This disparity not only highlights the varying user base and market penetration of each platform but also reflects broader trends in mobile device usage and platform preferences.

♦ Apple vs. Google Play (iOS vs. Android) Downloads Worldwide

Ever wondered why so many people go for android app development?

Global statistics for app downloads tells us Android holds a dominant position in the market share, which directly influences app download trends.

The majority of mobile app downloads worldwide originate from the Google Play Store, a reflection of Android’s broader device affordability and availability across diverse markets.

This dominance is a critical factor for app developers when deciding which platform to prioritize for their app development and marketing strategies.

These insights into mobile app download statistics shed light on the strategic decisions facing app developers and businesses.

Understanding the nuances between free versus paid apps, and the performance metrics of the Google Play Store versus the Apple App Store, allows industry players to tailor their approaches to maximize reach and profitability in the competitive app market.

♦ Mobile App Download Statistics Per Person

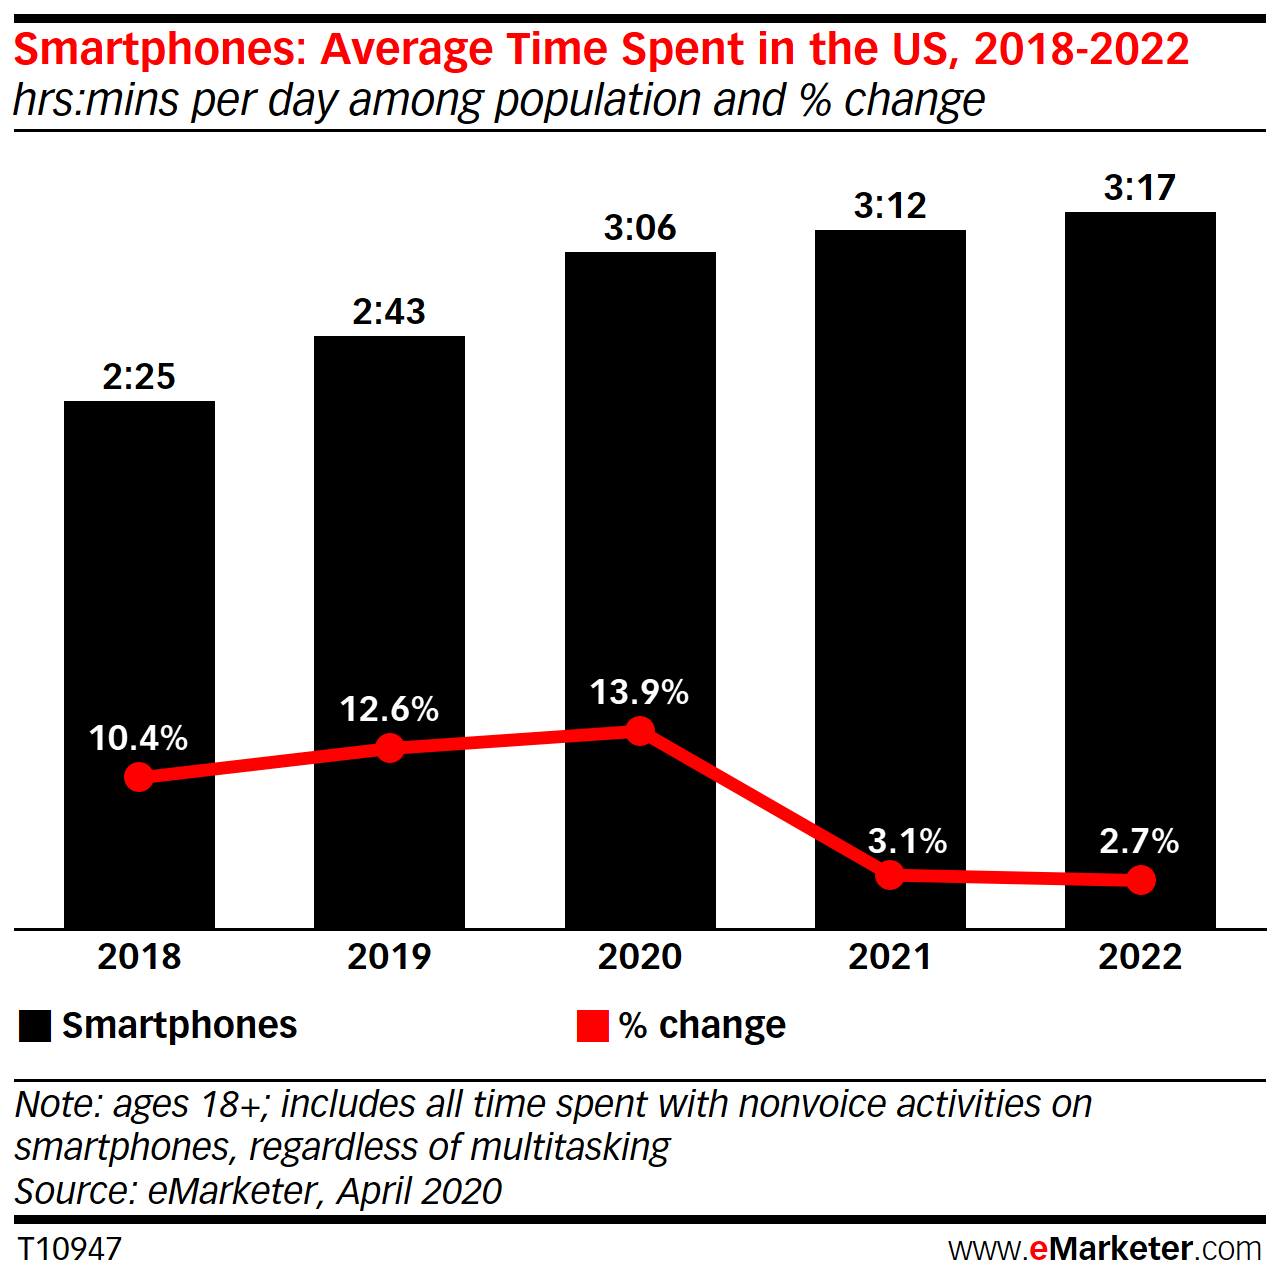
The average smartphone user spends about 3 hours and 10 minutes each day on their device, with 2 hours and 51 minutes of this time dedicated to app usage.

This equates to apps accounting for approximately 90% of total smartphone usage time. Such high engagement highlights the integral role of mobile apps in everyday life, emphasizing their value in entertainment, communication, productivity, and more.

On average, there are over 80 apps installed on a smartphone.

This statistic indicates that users have access to a wide range of apps to satisfy various needs and preferences.

However, the large number of apps installed does not necessarily translate into usage.

iOS App Store Statistics

The Apple App Store, a pivotal player in the mobile application market, continues to see significant growth and evolution.

This section delves into the latest download statistics and popular categories within the iOS ecosystem, providing insights into user preferences and app trends specific to Apple devices.

♦ Download Statistics

The iOS App Store has shown a notable increase in activity, with 600 million more app downloads reported compared to the previous year. In total, 2022 saw an impressive 24.3 billion app downloads. This upward trend highlights the continuing relevance and expanding reach of iOS applications in the global market.

As of 2023, there are 1,804,552 apps available on the Apple App Store, according to data from 42matters. The dynamic nature of the store is further evidenced by the fact that, on average, 1,223 apps are released daily. This constant influx of new applications keeps the platform fresh and offers endless new functionalities and experiences for users.

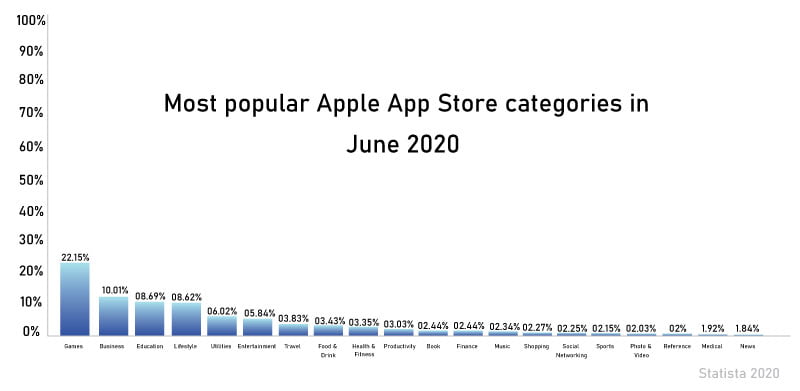
♦ Most Popular iOS App Store Categories

Understanding the most popular app categories on the iOS App Store can provide businesses with crucial insights into where consumer interests lie.

Although specific category rankings can fluctuate, categories such as games, business apps, educational tools, and lifestyle applications typically dominate the top spots.

These categories not only reflect current user engagement but also suggest areas of opportunity for new developments.

The popularity of these categories underscores the diverse needs and preferences of iOS users, from entertainment and personal enhancement to productivity and professional growth.

iOS app developers targeting the market would do well to consider these preferences in their app design and marketing strategies to align with the evident trends and maximize their reach and impact in the App Store.

By keeping a close eye on these iOS Play Store statistics, stakeholders in the mobile app industry can better strategize their entries and updates to the market, ensuring they meet the demands of an ever-evolving audience and stay competitive in one of the most influential digital marketplaces.

most popular app categories on the iOS App StoreSource: Statistics

Google Play Store Statistics

The Google Play Store remains a cornerstone of the Android ecosystem, providing a wide array of apps to cater to diverse user needs.

This section explores recent download statistics and the popularity of various app categories within the Google Play Store, shedding light on consumer behavior and the driving forces behind app profitability.

♦ Download Statistics

As of April 2021, the top-grossing Android apps globally are predominantly mobile games, with titles like Coin Master, Garena Free Fire, and PUBG Mobile leading the pack.

This dominance in the gaming category is projected to continue, with estimates suggesting that gaming apps will generate over 70% of Google Play’s app revenues by 2024.

The prevalence of free apps on Google Play necessitates effective monetization strategies, such as in-app purchases and advertising, to maintain substantial revenue streams.

Number of available applications in the Google Play Store

Source: Statista

♦ Most Popular Google Play Store App Categories

Understanding the most popular app categories can provide valuable insights into user preferences and market demands.

Here are the top categories based on user engagement:

  • Tools — 99.81%
  • Communication — 99.93%
  • Business Apps — 99.33%
  • Video Players & Edit— 96.63%
  • Travel & Local — 95.7%
  • Social Media Apps — 95.02%
  • Productivity — 91.67%
  • Music & Audio — 88.38%
  • Entertainment — 83.85%
  • News & Magazines — 81.11%
  • Photography — 75.77%
  • Books & Reference — 70.74%
  • Lifestyle — 65.67%
  • Personalization — 61.62%
  • Games (Casual) — 58.86%
  • Games (Puzzle) — 56.5%
  • Games (Arcade) — 55.08%
  • Shopping — 35.79%
  • Games (Action) — 34.19%
  • Weather — 32.46%

These categories reflect the broad spectrum of interests and needs of Android users, from utility and communication tools to entertainment and personalization apps.

The high engagement rates in essential categories like tools and communication apps underscore their indispensability to users’ daily digital interactions.

The Google Play Store statistics reveal not only the preferences of the Android user base but also the potential areas for growth and innovation for developers aiming to enter or expand their presence in this marketplace.

By aligning app development and marketing strategies with these insights, businesses can effectively tap into the vast opportunities presented by the Android app market.

Mobile App Usage Statistics

In today’s technology-driven world, mobile app usage statistics are invaluable for any entity involved in mobile development, from startups to established companies.

As smartphone penetration deepens globally, the reliance on mobile apps continues to soar, reshaping the landscape of digital interaction.

Highlighting trends in app engagement can equip businesses with the insights needed to tailor their strategies and develop applications that resonate with users.

Here’s a detailed look at the current trends in mobile app usage statistics:

  • Among millennials, 21% engage with their apps more than 50 times daily, showcasing a deep integration of apps in their daily routines.
  • A substantial 49% of all mobile users open an app more than 11 times a day, underscoring the essential role apps play in day-to-day activities.
  • In the United States, mobile apps represent 70% of digital media time, highlighting a significant shift towards mobile-first consumption.
  • The average smartphone user is quite active, with ten apps used daily and 30 apps interacted with monthly, reflecting a broad spectrum of app utility from convenience to entertainment.
  • The Google Play Store offers a vast array of choices with 3,562,951 mobile apps available, crafted by 1,114,154 app publishers. This includes 455,022 gaming apps and 3,107,929 non-gaming apps, illustrating a diverse and dynamic app ecosystem.

These statistics not only elucidate user behaviors but also pinpoint the growing influence of mobile apps in everyday life.

As the app market continues to evolve, understanding these mobile app usage statistics becomes a cornerstone for success in a competitive digital world.

This comprehensive analysis serves as a strategic tool for those looking to innovate and lead in the mobile app space.

  • Time of App Usage

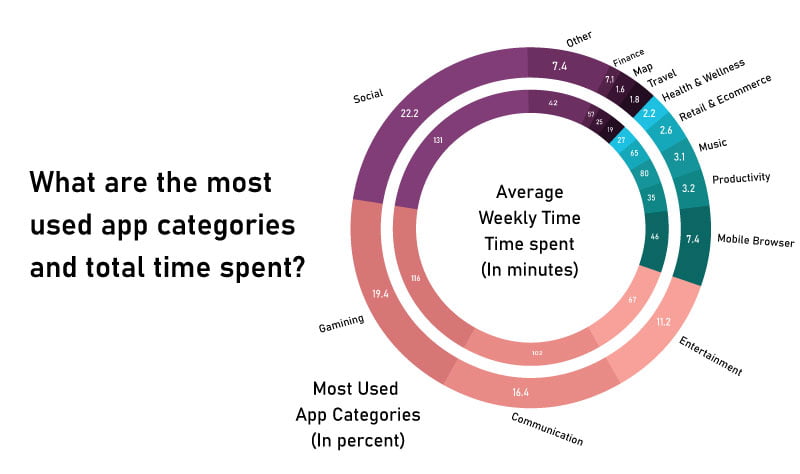
Analysis of time spent on apps reveals that users predominantly engage with social media apps, followed by gaming and communication apps.

This pattern correlates with the overall popularity of these apps.

Interestingly, despite the lower download rates for retail and e-commerce apps (only 2.6% of total downloads), the time spent within these apps is considerably higher.

This is likely because users take more time to make purchasing decisions, reflecting a deeper engagement level when using these types of apps.

Similarly, fintech app statistics show that while they aren’t the most downloaded, see higher engagement times as users interact with these platforms more intensively.

Mobile App Usage by Age

Let’s look at app statistics for usage by age.

Understanding how different age groups interact with mobile apps provides valuable insights into user preferences and behaviors.

This segmentation is crucial for developers and marketers to tailor their apps and marketing strategies to target specific demographics effectively.

♦ Age-Specific App Usage Trends

Younger adults, as anticipated, are the most active users of mobile apps. They engage extensively with various app categories, from social media and gaming to productivity and educational apps. As we examine older demographics, there is a noticeable decline in app usage. Notably, individuals aged 65 and older spend about 51.4 hours a month on apps. This equates to roughly 1 hour and 43 minutes per day, which, while lower than younger age groups, still signifies considerable engagement, particularly in categories like health, news, and communication.

Averge monthly hours per mobile app user by age

♦ Smartphones vs. Tablets

Globally, smartphones significantly outnumber tablets, with approximately 2.7 billion smartphones in use compared to 1.35 billion tablets. However, the gap in usage between these devices is narrowing as tablets become increasingly utilized for specific types of activities.

♦ Tablet Usage

Tablets may not be as ubiquitous as smartphones, but they serve distinct purposes that often complement or extend the capabilities of smartphones. Tablets are particularly favored for their larger screens and enhanced visual capabilities, making them ideal for the following popular app categories:

  1. Educational Apps: Tablets are extensively used in educational settings, benefiting students with interactive learning apps that are more engaging on larger screens.
  2. Productivity Apps: Many professionals and creatives prefer tablets for productivity apps, including document editing, project management, and design software, which benefit from the increased workspace.
  3. Health and Fitness apps: Tablets are used for health and fitness apps, particularly in home workout setups where larger displays help users follow exercise routines more effectively.
  4. Entertainment and Media: Tablets are popular for entertainment, especially for streaming video content, reading e-books, and playing games, thanks to their larger displays and improved visual experience.

Understanding these usage patterns by age and device can significantly impact how apps are designed, marketed, and optimized.

Similarly, acknowledging the distinct roles of smartphones and tablets in the consumer’s digital ecosystem can guide developers to create more device-specific experiences, enhancing user satisfaction and engagement.

Essential Mobile App Statistics

It goes without saying mobile app market is filled with popular apps that is loved by masses whether you talk about fintech apps, dating apps, or fantasy sports app.

Speaking of which, let’s look at apps American people can’t live without below:

The Apps Americans Can't Live Without

  • Most Popular Mobile App Statistics

Mobile apps statistic shows us a lot of things.

This time it takes us to the most popular apps. More often than not, this chart is led by social media apps like Snapchat.

For instance, in 2023, Instagram topped the list with 696 million downloads, followed closely by TikTok with 654 million downloads. Other notable apps include:

AppDownloads (mm)
Instagram696
TikTok654
Facebook553
WhatsApp475
CapCut389
Telegram355
Snapchat343
Temu274
WhatsApp Business267
Spotify248

Sources: AppfiguresAppMagic

These statistics provide insights into current trends and shifts in user preferences, highlighting the fluctuating popularity among different app categories.

Mobile App User Growth Statistics

The expansion of the mobile app user base is a key indicator of the digital landscape’s evolution.

These app statistics not only highlight the increasing dependence on mobile technology but also provide insights into user behavior, retention rates, and the challenges of maintaining user engagement over time.

♦ Internet Usage on Mobile Apps

A staggering 90% of internet time for users is spent on mobile applications, demonstrating the central role that apps play in everyday digital interactions.

This mobile app statistic is a clear testament to how integral mobile apps have become for communication, entertainment, business, and personal productivity.

♦ Annual Growth of Smartphone Users

The smartphone revolution continues to influence technology adoption globally.

Each year, the smartphone user base has seen a growth of approximately 0.3 to 0.6 billion.

This consistent increase reflects the ongoing demand for mobile connectivity and the expanding accessibility of smartphone technology in emerging markets.

♦ Mobile Network Subscriptions

In 2022, the number of smartphone mobile network subscriptions reached nearly 6.4 billion, with projections indicating that this number will surpass 7.7 billion by 2028.

This growth statistics are indicative of the expanding global reach of mobile technology and the increasing adoption of smartphones as primary devices for internet access.

♦ App Retention Rates by Country

App retention rates vary significantly by country, showcasing different user engagement levels across cultural and economic contexts.

Japan leads with the highest app retention rate at 5.1%, signaling strong user loyalty and engagement.

In contrast, China experienced the lowest retention rate in 1.3%, pointing to challenges in maintaining user interest over time.

♦ Retention Rates by App Category

According to a Statista mobile app report from January 2024, different app categories exhibit varying retention rates.

As of the third quarter of 2023, social media apps had the lowest 30-day retention rate at 1.37%, whereas news and magazines apps performed best with a retention rate of 9.1%.

These figures highlight the challenges and opportunities within specific app niches in keeping users engaged.

♦ User Abandonment Rates

The challenge of retaining users is further emphasized by high abandonment rates.

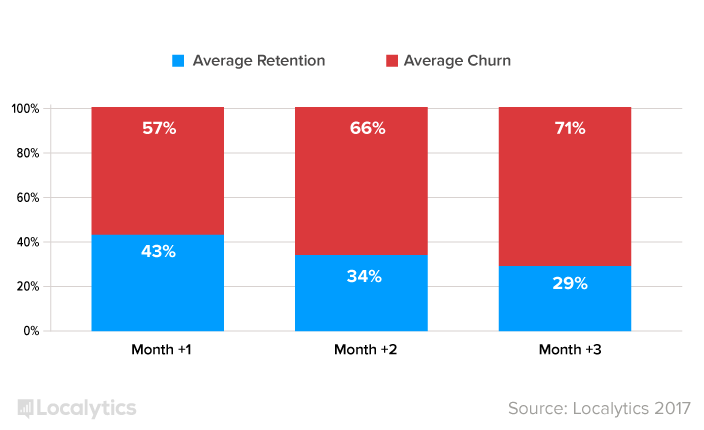
About 25% of users abandon an application within the first day, and a staggering 72% do so within the first 30 days.

These statistics are crucial for developers and marketers as they underscore the importance of creating engaging, valuable, and user-friendly app experiences right from first use.

These mobile app user growth statistics provide valuable insights for the industry, pointing to the importance of not only attracting users but also retaining them through continuous improvement and understanding of user needs and preferences.

Mobile App Retention Rate Statistics

It’s time to look at another important area of mobile app statistics: retention.

Retention rates are crucial metrics in the mobile app industry as they reflect user engagement and satisfaction with an app over time.

These application statistics help developers and marketers understand how well their apps are keeping users interested and pinpoint areas for improvement.

In layman’s terms, it’s the force behind successful app marketing.

♦ Retention Rates by Country

The disparity in app retention rates between countries can reveal much about regional preferences and app usability.

Japan leads with the highest app retention rate at 5.1%, suggesting a highly engaged user base that finds apps relevant and useful.

Conversely, China has the lowest retention rate at 1.3%, indicating potential issues with user engagement or app relevance in this market.

These figures highlight the importance of cultural and regional considerations in app development and marketing.

♦ Retention Rates by App Category

Different app categories also exhibit varying levels of user retention.

According to a mobile app Statista report from January 2024, the 30-day retention rates for app categories show significant variation.

Social media apps have the lowest retention rate at 1.37%, possibly due to the high competition and transient nature of trends within this category.

On the other hand, news and magazine apps boast the highest retention rate at 9.1% for the third quarter of 2023, likely due to ongoing user interest in current events and high-quality content that encourages repeated use.

These mobile app retention rate statistics illustrate the challenges and opportunities within the app development industry.

Effective measures might include enhancing app functionality, streamlining user interfaces, and creating personalized user experiences that cater to the needs and preferences of different regional and demographic user bases.

For anyone involved in mobile app development, these insights are crucial for aligning product strategies with user expectations and improving overall app performance in a competitive market.

Mobile App Engagement Statistics

Engagement is a critical factor in the success of mobile apps, as it directly influences user retention, satisfaction, and ultimately, the profitability of an app.

These mobile app statistics provide a detailed picture of current trends in user engagement and highlight the effective strategies and challenges within the mobile app landscape.

♦ Impact of Gamification on Engagement

Incorporating gamification into mobile apps has proven to be a highly effective engagement strategy.

Organizations that employ gamification techniques see a significant 54% increase in trial usage of their apps, along with a 15% increase in buy clicks.

This approach capitalizes on the natural human tendencies towards competition and curiosity, encouraging users to engage more deeply with the app and its features.

Such strategies not only enhance the user experience but also contribute to higher retention rates as users find more value and fun in the app functionalities.

♦ Daily and Monthly App Usage

On average, a typical app user interacts with nine apps daily and 30 apps monthly.

This statistic highlights the competitive environment within the app ecosystems, where numerous apps vie for user attention.

It underscores the importance of creating standout apps that provide clear value and excellent usability to become part of the daily usage roster of users.

♦ App Abandonment Due to Performance Issues

Performance issues are a major deterrent for app engagement. Approximately 70% of users abandon mobile apps due to high loading times.

This emphasizes the need for developers to optimize app performance, ensuring quick load times and smooth operation to prevent user frustration and abandonment.

♦ App Deletion Rates

The first month after download is critical for app retention, with one in two apps being removed by users during this period.

The primary reason cited for these deletions is a lack of use, which could be attributed to several factors including poor user experience, lack of engaging content, or failure to meet user expectations.

Addressing these issues early in the app development and post-launch phases is vital to decrease deletion rates.

♦ Contribution to Digital Media Time

Mobile applications account for nearly 70% of the US digital media time, indicating their dominant role in digital interactions.

This dominance provides a tremendous opportunity for app developers and businesses to capture user attention and deliver engaging content and functionalities that cater to the evolving demands of users.

These mobile app engagement statistics underscore the importance of focusing on user experience, performance optimization, and innovative engagement strategies like gamification to enhance user interaction. By understanding and addressing the factors that influence app engagement, developers and marketers can significantly improve the success rates of their mobile apps in a crowded market.

CTA 2_Schedule a Free Consultation

Mobile App Monetization Statistics

App Monetization is a pivotal aspect of the mobile app industry, as it directly affects the viability and sustainability of app projects.

Understanding the current trends and statistics in app monetization can help developers and businesses devise effective strategies to maximize revenue from their mobile apps.

  • According to app statistics report, consumer spending in mobile apps is expected to exceed $270 billion by 2025, driven largely by in-app purchases, subscriptions, and advertising.
  • Freemium models dominate app stores, where apps are free to download but monetized through in-app purchases and ads. This model combines the broad reach of free apps with the revenue potential of paid features.
  • A study revealed that subscriptions apps for about 19% of total app store revenue. The model has seen growth in non-gaming apps, particularly in categories like video streaming and dating.
  • Ad-based revenue is particularly strong in utility and entertainment apps, with video ads offering the highest engagement and revenue per user.
  • The effectiveness of in-app purchases can be seen in the gaming sector, where they contribute up to 79% of total revenue in mobile gaming.

Mobile App Monetization Statistics

Mobile App Development Statistics

Whether you want to build a fintech app or create a social media app, understanding mobile app development statistics becomes super important.

The landscape of app solutions is dynamic and rapidly evolving, with significant activity across various app stores and continuous investment in mobile technologies.

These mobile app statistics provide a snapshot of the current state and future potential of the mobile app market, illustrating trends in app releases, availability, and economic impact.

  • In February 2024, 48,056 apps were published or added to the Google Play Store, reflecting the high volume of development activity aimed at Android users.
  • The Apple App Store currently hosts about 1.96 million applications, making it a significant marketplace for iOS users seeking a variety of apps.
  • On average, 1,251 apps are published daily on the Apple App Store, with a total of 36,767 apps released in February 2024 alone. This highlights the continuous flow of new ideas and innovations being made available to Apple users.
  • The Google Play Store offers a broader range of applications with 2.87 million apps available for download. This larger inventory can be attributed to the more open nature of the Android platform and its broader developer base.
  • Significant technological investments are underway, with mobile operators spending $160 billion annually on the deployment of 5G technology to enhance network capabilities. This investment is pivotal in improving app functionality and user experience, facilitating more advanced mobile applications that require high-speed data connectivity.
  • Consumer spending on apps is projected to reach $171 billion annually by 2024, indicating robust market demand and significant revenue opportunities for app developers.
  • The on-demand mobile app sector is poised for substantial growth, with its value expected to reach nearly $330 billion by 2025. This growth reflects increasing consumer preference for on-demand services, such as food delivery, ride-sharing, and home services, facilitated through mobile apps.
  • The global market for Progressive Web Apps (PWAs) was valued at $1.13 billion in 2016 and is anticipated to grow at a CAGR of 31.9%, reaching $10.44 billion by 2027. This significant growth is driven by the advantages of PWAs, including lower development costs, ease of distribution, and excellent performance across all platforms.

These mobile app development statistics underscore the vibrant and expanding nature of the mobile app industry.

Mobile App Design Statistics

In the competitive realm of mobile apps, the quality of UI/UX Design can significantly determine an app’s success or failure.

Below are some vital app design statistics and insights that underscore the importance of effective mobile app design and development:

♦ Role of Good UI/UX

Approximately 85% of users expect a mobile page or app’s UI/UX to be superior to its desktop counterpart, highlighting the critical importance of optimizing mobile experiences beyond those offered on desktop platforms.

♦ Effect on Brand Image

About 65% of users report that a poor mobile experience negatively impacts their perception of a brand. This demonstrates the necessity for businesses to invest in high-quality app development tools and prioritize seamless mobile experience.

♦ Ideal App Loading Time

Around 43% of users express dissatisfaction if an app takes more than three seconds to load. Furthermore, 70% of users are likely to abandon an app altogether if it loads too slowly, emphasizing the need for efficient, lightweight app designs

♦ Performance Affects Retention

Approximately 71% of app uninstalls are attributed to app crashes, indicating that app stability is a key factor in retaining users.

♦ Inconsistencies in the App’s Interface

About 58% of users find inconsistencies in an app’s interface frustrating. This highlights the importance of maintaining a consistent and intuitive user interface across all aspects of the app

♦ Overall App Performance

If an app’s overall performance is subpar, 52% of users become frustrated, which can directly lead to uninstallations.

♦ Value from an App

Nearly 29% of users will abandon an app quickly if it does not provide immediate value. It’s crucial for apps to clearly demonstrate their usefulness right from the initial interaction.

♦ Impact of Data Consumption

Around 37% of millennials consider an app’s data consumption when deciding whether to download and use it. Apps that excessively consume data may be at a higher risk of being deleted, underscoring the need for developers to optimize data usage within their apps.

These app statistics reveal the profound impact that UI/UX design can have on a mobile app’s adoption and retention rates.

Implementing robust design and development practices will help in creating apps that are not only functional but also enjoyable to use, thereby increasing the likelihood of sustained user engagement and success in the competitive app market.

App Store Optimization statistics

App Store Optimization (ASO) is essential for ensuring that mobile apps reach their target audience effectively.

The visibility of an app in app stores can significantly influence its success.

Here are some pivotal statistics that highlight the importance of ASO and effective strategies to enhance app discoverability and conversion rates.

♦ Discovery of Apps

About 51% of users discover new apps through recommendations from friends or family, indicating the importance of word-of-mouth in app marketing.

In addition to this, app statistics show that approximately 48% of users find apps by browsing app stores directly.

This underscores the need for apps to stand out through effective ASO practices.

Therefore, seeing recommendations and ads are significant for 34% of users when it comes to app discovery.

Thus, pointing towards the efficacy of advertising and featured listings in driving app awareness

♦ Mobile App Updates

Over half of the 100 most successful apps on app stores update their applications every ten days.

This frequent update not only fixes bugs and improves functionality.

But it also signals to the app stores that the app is being actively maintained, which can boost ASO

♦ Importance of App Store Reviews

77% of users read at least one review before downloading a free app, and 80% do the same for a paid app.

This highlights the critical role that user reviews play in the decision-making process of potential downloaders

♦ Conversion through App Store Pages

The conversion rate from page view to install is 33.7% for the App Store and 26.4% for Google Play.

In addition to this, the app statistics illustrate the effectiveness of well-optimized app store pages.

Users spend an average of 10 seconds on an App Store page and 14 seconds on a Google Play page.

This brief interaction period emphasizes the need for a compelling app listing that quickly captures interest and conveys the app’s value

♦ Strategic Implications

These statistics demonstrate the critical need for effective ASO strategies. To enhance visibility and conversion rates, developers should focus on:

  • Regular Updates: Keep the app updated with new features, bug fixes, and improvements to maintain high rankings.
  • Optimizing App Listings: Create engaging descriptions, use high-quality screenshots, and leverage SEO strategies to improve visibility.
  • Managing Reviews: Encourage satisfied users to leave positive reviews and address negative feedback promptly to improve the app’s reputation.
  • Effective Use of Media: Utilize video trailers and graphics to make the app page more engaging and informative.

By understanding and implementing these ASO strategies, developers can significantly increase their app’s chances of discovery and success in highly competitive app markets.

Future Mobile App Industry: What does the future look like?

global app store and google play spending

Source

The mobile app industry continues to show robust growth and significant innovation, with predictions indicating substantial increases in app downloads, revenues, and shifts in user behavior.

Here’s a detailed look at what the future may hold for the mobile app sector based on various industry forecasts.

♦ App Download Forecast

Here’s what Statista shows us:

  • Google Play Store: By 2026, it is projected that consumers will download 143 billion mobile apps from the Google Play Store, representing a nearly 30 percent increase from 111 billion apps downloaded in 2021.
  • Apple App Store: Expected to generate 38 billion downloads by 2026, marking an increase of about 15 percent over five years. This growth, although more moderate compared to Google Play, reflects a steady demand within the iOS ecosystem

♦ App Economy Forecast

The total revenue generated through apps is expected to grow at an annual rate (CAGR) of 8.58 percent from 2022 to 2027, culminating in a market volume of approximately $756 billion by 2027.

This growth is driven by expanding global access to smartphones and the increasing utility of mobile applications in daily activities

♦ Future of App Stores

By 2027, spending on the Apple App Store alone is forecast to reach US$125 billion.

When combined with user spending in Google Play, total expenditures are estimated to nearly hit $186 billion.

This significant spending underscores the lucrative nature of the app market and the ongoing investment by users in mobile applications.

♦ Mobile Payment Forecast

The global mobile payment statistics anticipates market size to expand from $2.98 trillion in 2023 to US$18.84 trillion by 2030.

This projection, showing a CAGR of 30.1 percent, reflects the increasing adoption of mobile payment solutions worldwide, driven by convenience and the integration of financial services into mobile platforms.

♦ Top App Categories Forecast

While gaming apps continue to lead, other categories such as social, entertainment, and productivity apps are expected to see significant growth.

Social and entertainment apps are likely to each secure a six percent revenue share by 2026, highlighting their increasing popularity and potential for revenue generation.

Should You Develop an App in 2024?

Deciding whether to develop an app in 2024 involves considering the current trends, future forecasts, and understanding the potential for profitability and engagement in the mobile app market.

Mobile App Statistics not only emphasize the enduring vitality of this sector but also highlight the immense opportunities that await those ready to dive into app development.

Here are compelling reasons to hire an app developer and start your journey.

1. Continued Market Growth

The global mobile app market is booming, projected to reach a staggering $756 billion by 2027, growing at a compound annual growth rate (CAGR) of 8.58% from 2022 to 2027.

This growth is fueled by continuous advancements in mobile technology, deeper smartphone penetration, and evolving user habits that emphasize convenience and efficiency.

2. High User Engagement

Apps have become an integral part of daily life for millions of users.

On average, a smartphone user interacts with 30 applications per month, and about 51% check their apps between one to ten times daily.

This high level of engagement presents a fertile ground for new apps to thrive.

3. Increasing Revenue from Mobile Apps

The revenue from mobile apps is expected to see a sharp increase, with projections estimating it will rise from $522 billion in 2024 to $673 billion by 2027.

The majority of this revenue comes from free apps that capitalize on in-app purchases and advertising, showcasing successful monetization strategies that new apps can adopt.

4. Global Impact and Reach

The global nature of the mobile app market allows developers to reach audiences worldwide.

For instance, key markets such as China, the USA, and Japan are driving substantial financial volumes within the app industry, providing ample opportunities for localized and global app solutions.

5. Technological Advancements

With significant investments flowing into mobile technologies such as 5G, developers have new opportunities to create more sophisticated and responsive apps.

These solutions cater to modern users’ demands for speed and seamless functionality.

Discover Excellence with Nimble AppGenie

At Nimble AppGenie, we don’t just develop apps; we create digital solutions that transform businesses.

With a robust portfolio of over 350 successful projects and a diverse client base of 250 satisfied customers, our expertise in mobile app development is both proven and trusted.

As a leading mobile app development company, our client retention rate of 98% speaks volumes about the reliability and quality of our work.

We are proud to be consistently recognized as one of the top developers in the industry by prestigious platforms like Clutch.co, TopDevelopers, and DesignRush. These accolades reflect our commitment to excellence and innovation in every project we undertake.

Why Choose Nimble AppGenie?

Because we understand that your app isn’t just a piece of software, but a pivotal tool in your business strategy. Our tailored solutions are designed to meet your unique needs, ensuring that each project is not only successful but also delivers tangible results.

Join the ranks of our satisfied clients and experience service that goes beyond mere development. Contact Nimble AppGenie today and let us help you turn your app idea into a reality that stands out in the competitive digital market.

Bottom Line

The mobile app industry continues to experience explosive growth, with trends showing significant increases in app downloads, user engagement, and revenue generation. As smartphones become more ingrained in our daily lives, the importance of mobile apps in entertainment, productivity, social connectivity, and even financial transactions is more pronounced than ever. With an average user spending nearly three hours per day on mobile apps and having over 80 apps installed on their devices, the opportunity for app developers and businesses is immense.

However, the challenges of app retention, user engagement, and effective monetization remain prevalent. Statistics reveal that while many apps are downloaded, a smaller number see regular use or significant revenue generation. This underscores the critical need for focused app store optimization, strategic marketing, robust design, and continuous updates to enhance user satisfaction and retention.

FAQs

The cost of developing a mobile app can vary widely depending on the app’s complexity, platform (iOS or Android), and specific features. Typically, costs can range from $20,000 for a basic app to over $250,000 for a feature-rich, custom-built app.

The development time for a mobile app can vary from a few weeks to several months, depending on the complexity of the app and the development process. On average, it takes about 4-6 months to develop a fully functional mobile app.

Native apps are developed for specific platforms (iOS or Android) using platform-specific programming languages. Hybrid apps are built using web technologies like HTML5, CSS, and JavaScript, and then wrapped in a native container that allows them to operate like a native app. Web apps are essentially websites that are optimized to function like apps but are not installed directly on a device.

Security is paramount in mobile app development. We employ various measures such as secure coding practices, data encryption, secure back-end and API communication, and regular security testing to ensure that the app and its data are protected against threats.

Yes, mobile apps can be integrated with a wide range of third-party services including payment gateways, social media platforms, cloud services, and analytics tools to enhance functionality and user experience.

User experience (UX) is often the most critical factor. An app must be intuitive, engaging, and satisfying to the user’s needs. Proper attention to UX can dramatically impact the usability and popularity of an app.

Regular updates are crucial to maintain app functionality and security. Most successful apps are updated at least once a month, but more frequent updates may be necessary depending on user feedback and evolving requirements.

Common reasons include poor user experience, lack of originality, inadequate market research, poor performance, and failure to update regularly or respond to user feedback.

There are several monetization strategies including in-app purchases, subscription models, advertising, paid apps, and sponsorships. Choosing the right strategy depends on the app’s audience and purpose.

Current trends include artificial intelligence, machine learning, augmented reality, virtual reality, Internet of Things (IoT) integration, mobile wallets, and blockchain technology. These trends are helping to create more personalized and interactive app experiences.

Table of Contents