Have you noticed how well social media apps have taken over the market?
You might be using at least one social media app, right? That’s the impact of it on users. It not only influences them to use one of these platforms but also helps them to find a way to fulfill their needs.
Social media has created a revolution. It has become a way to influence people in a manner that changes their behavior and mindset.
Well, here we are discussing certain reasons that make it so amazing to change the lives of people. Market statistics not only help you to get what’s going on but also to keep an eye on it to optimize the data in your favor.
If you are the one looking to develop a social media app, then it’s the right platform to know about the market. After all, it’s the first step that takes you close to making a dream app.
Digital Revolution: Social Media Surge
Before we jump into social media statistics, let us quickly take a look at how exactly these platforms emerged and became a key part of every modern-day internet user.
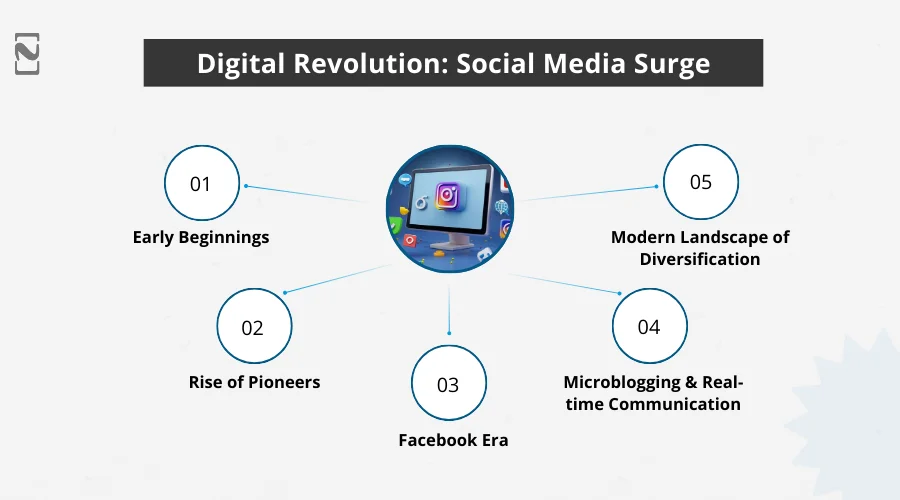
► Early Beginnings
- It all started in the years 1970- 1995, when the PLATO system offered early forms of social media with notes.
- Next comes Bulletin Board Systems (BBS) and online communities that have permitted users to share information over telephone lines.
- Then, from 1995 to the 2000s, platforms like classmates.com and Six Degrees were considered the very first social networking sites.
► Rise of Pioneers
- Later in the year 2002, the platforms, including Friendster and MySpace, evolved.
- LinkedIn evolved as a platform targeting professionals in the year 2003.
► Facebook Era
- One of the platforms that experienced an outbreak was Facebook in the year 2004. With its innovative features, it has become a favorite platform in that era.
- YouTube evolved in the year 2005, providing space for users to upload, share, and view videos, giving rise to a new era of content creation.
► Microblogging and Real-time Communication
- Later on, in 2006, Twitter introduced microblogging, helping users to post short and real-time updates.
- Visual content was followed in 2010 when Instagram came into existence.
► Modern Landscape of Diversification
- Now, it was the time for filters and editing that had diversified the scope of social media.
- Platforms like Snapchat and TikTok came into existence in the years 2011- 2016.
- The current era of social media is vast, with multiple sites and apps.
Now, as you get a brief about the social media surge and information about its history. It’s time to have certain current stats. Proceed to the next section to find it.
Key Social Media Statistics You Must Know!
The past of social media does not have an impact on the present. To develop a social media app, all you need is the present data that will influence the future.
Before we jump into the technicalities of social media statistics and how they impact the market.
Let’s start with some key statistics to warm things up :
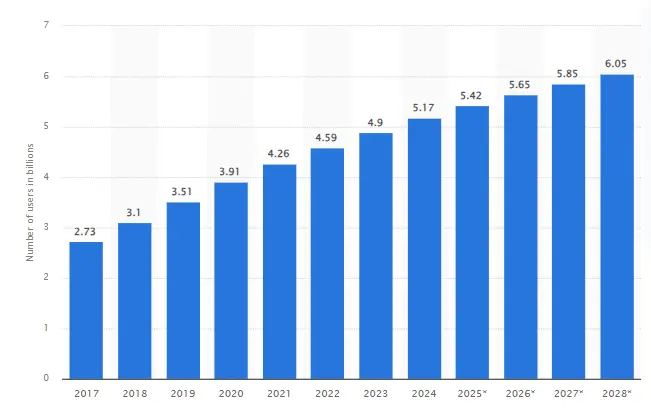
- In 2025, over 5 billion people are using social media, and this number is projected to reach over six billion in 2028.
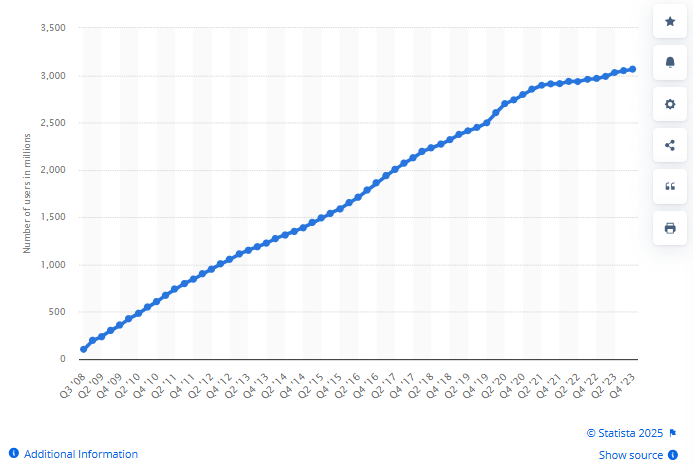
- The registered number of users of social media platforms like Facebook is 3,065 million.
- As of April 2024, there are 5.07 billion people, or 62.6% of the world’s population use social media platforms.
- The global social media penetration rate is forecasted to increase from 2024 to 2028 by 11.6%.
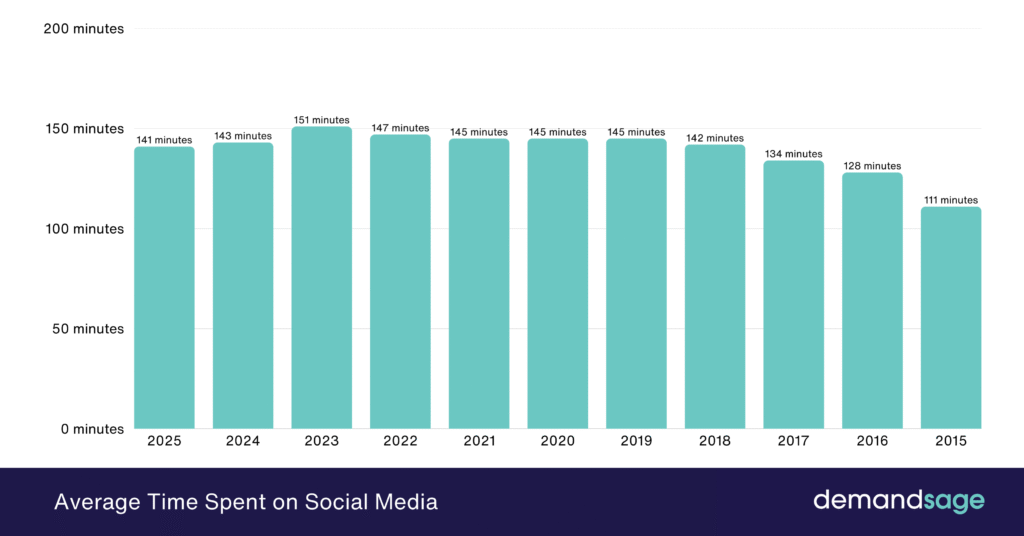
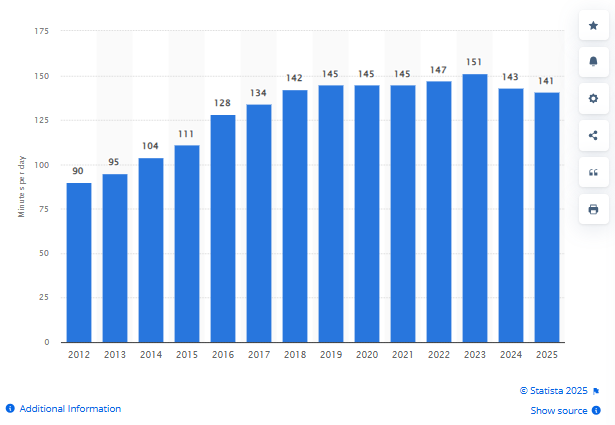
- The daily average time usage worldwide amounts to 143 minutes per day.
- Social media platforms, including Facebook, Instagram, and YouTube, derived nearly approx. $11 billion through advertising.
- China has the largest number of social media users in the world, with over 1.03 billion active users.
- 59% of people reported that social media has impacted their mental health.
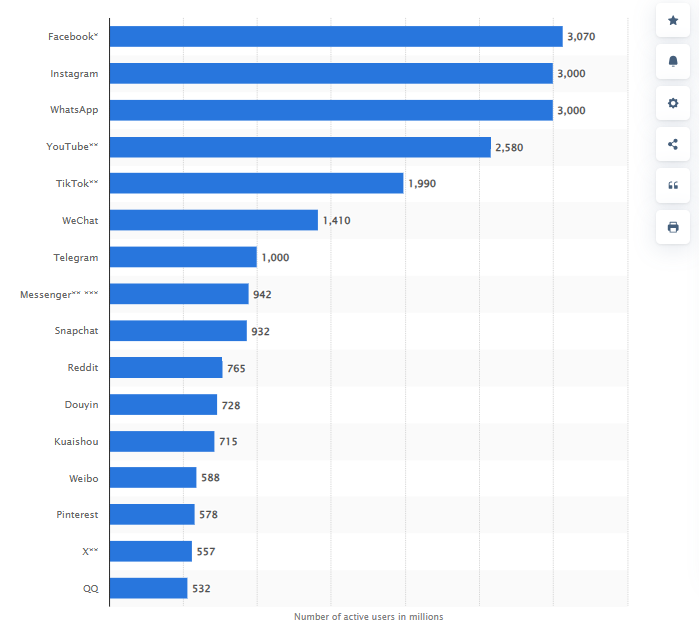
- Facebook has the most users at three billion, which are followed by YouTube and WhatsApp. It has become the most used social networking app in the US, which is followed by Instagram.
- Threads with 400 million+ MAUs became one of the most popular and fastest-growing social media platforms in history, doubling its monthly active users in under a year.
The social media app stats reflect not much change; however, since 2021, you can observe a major change in platform usage.
With all of that, you might have got a clear idea that the market for social media and usage of these platforms is certainly growing better than ever.
Many of the market pundits tend to believe that the social media market has reached its saturation point. However, the user stats clearly show a demand.
The social media statistics clearly state that building your own platform can be a good business strategy in 2026, considering the user data is extremely motivating.
What do the social media usage statistics say about the upcoming years?
Social Media App Usage & Engagement Statistics
One of the key social media statistics that makes it much more interesting for someone who plans to invest in the field is the usage and engagement numbers. You see, a social media platform is always judged by the numbers it yields in terms of user engagement.
When there are so many platforms in play, knowing the engagement and usage numbers can help you identify which platforms are popular, which are the most used platforms, and exactly how you should approach your project.
Here are social media user statistics that you can use to consider your app effective :
- The number of people using social media is over five billion, which is projected to cross six billion by 2028.
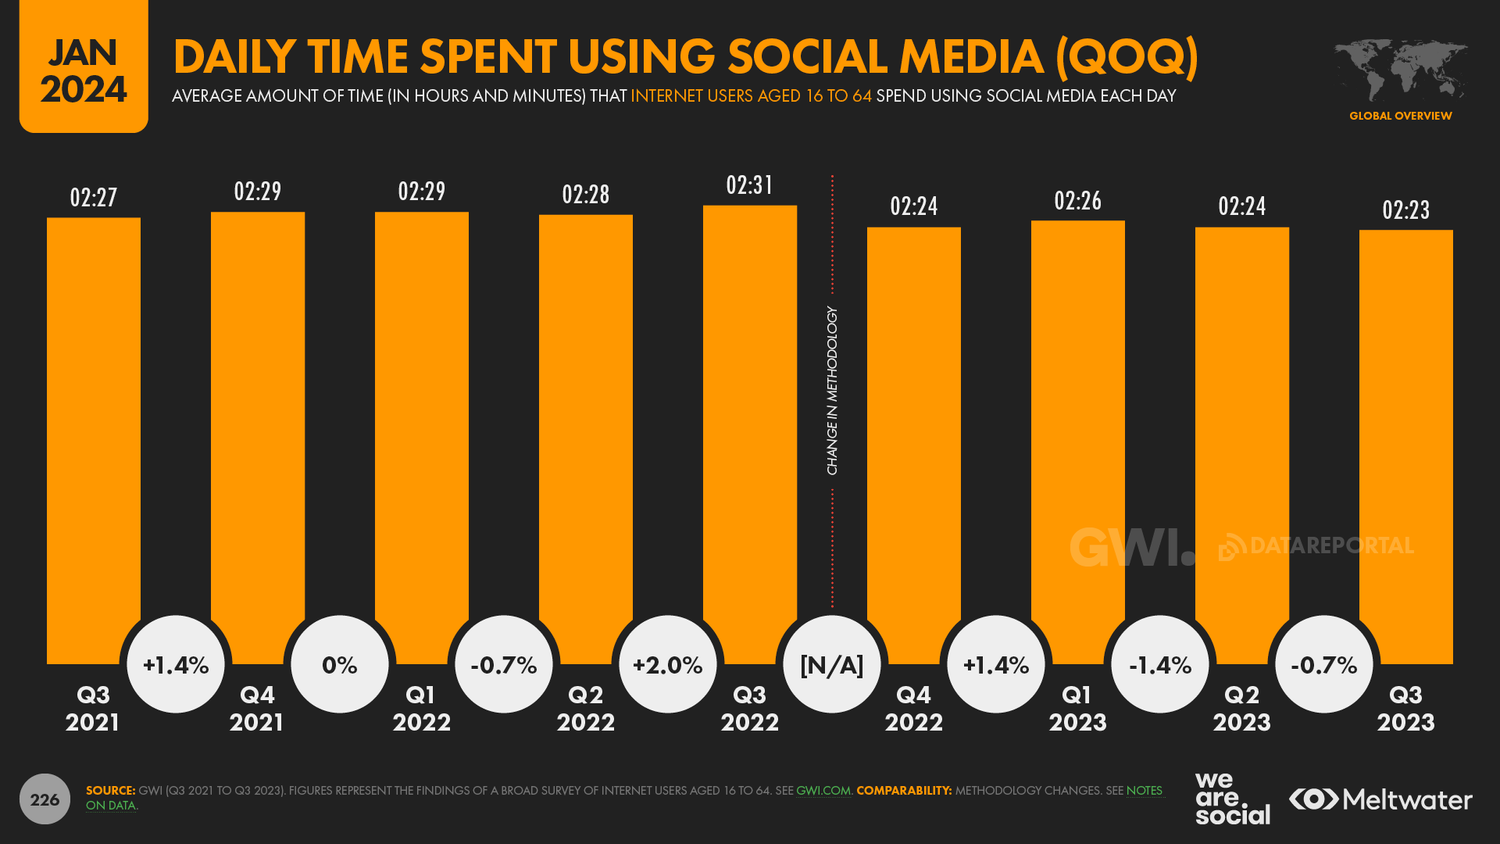
- The global average time that a user spends on social media is 2 hours 21 minutes.
- With so many different social media platforms, an average user juggles between 6 and 7 social media platforms every month.
- Short videos are a great hit among users. TikTok is one of the biggest platforms where an average user spends 35 hours every month, making it a market leader with the most time per user.
- Smartphones are generally the preferred means of using social media platforms, as more than 92% of all social media time spent is on a smartphone.
The numbers can certainly be quite unbelievable for someone who is not completely aware of the impact that social media platforms hold.
To achieve such numbers for your own social media solutions, you need to identify exactly why people tend to use social media in the first place. In the next section, let’s dig a little deeper and learn what motivates people to use these platforms.
Why Do People Use Social Media? Social Media Statistics
The idea of using social media originated with a thought of using the internet as a place where people can stay connected with one another passively, without having a direct active connection like calls and texts. Social platforms allow people to stay in touch with each other in ways one can imagine.
From knowing when a friend was out of town to identifying exactly where they had gone, a social network can help with all. However, that is just the tip of the iceberg, as there are a lot of reasons and features that motivate people to use social media.
Here is a sneak peek into social media statistics that show some core factors that make people use social media.
- 58.8% of people stated that social media platforms help them to stay connected with family and friends.
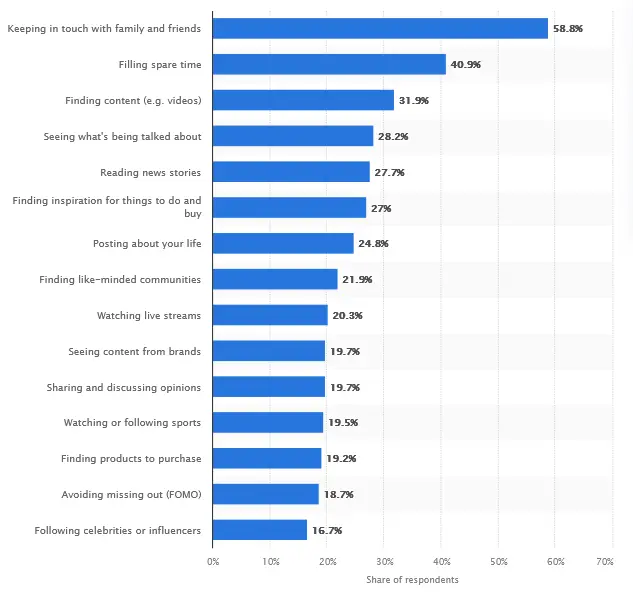
- 40.9% stated that they desire to fill their spare time. 31.9% did it to find content.
- According to social media stats defined by Forbes, social media platforms are designed to enhance sales by 150% compared to solely websites.
- About two-thirds of online adults, which is approximately 66%, stated that they use social media platforms to keep in touch with their friends and family.
- While 44% stated that users around a shared hobby or interest is one of the major reasons that they use social networking platforms.
- According to a survey, it has been revealed that less than half of social media account holders post content at least occasionally. They are inclined towards browsing rather than posting content.
With all those numbers giving you clarity on what type of features or use cases generally motivate a user to interact with a social media platform, you can easily identify the type of social media app to develop.
Top Social Media Apps and Their Statistics
Another interesting way to look at social media statistics is to identify which type of social media app is popular.
Let’s take a look at the following list, where we have mentioned the top apps that dominate the market and significant statistics that give you an understanding of their impact.
1. Facebook
- Facebook is among the top-used social media platforms in the current era. It was the first platform to pass one billion registered accounts and has more than three billion monthly users.
- According to Britannica, Facebook is among the largest social networks with approximately 3 billion users, and about half of these people use the platform almost every day.
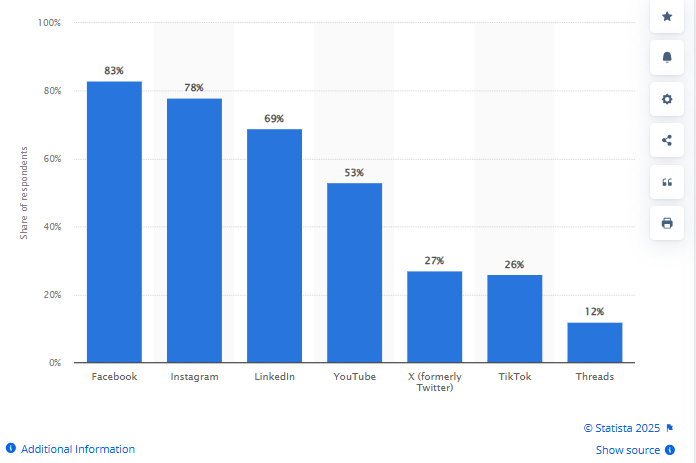
- Based on a global survey, 89% were responding to social media marketers who used the network to promote their businesses, and Facebook was among the most commonly used platforms.
- The number of monthly active users of Facebook as of the 4th quarter of 2023 was 3 billion.
2. Instagram
- Instagram’s growth statistics show that it has become the third most preferred app, followed by Facebook and YouTube.
- Based on the data from Kepios, 0.2% of Instagram users are unique to the platform.
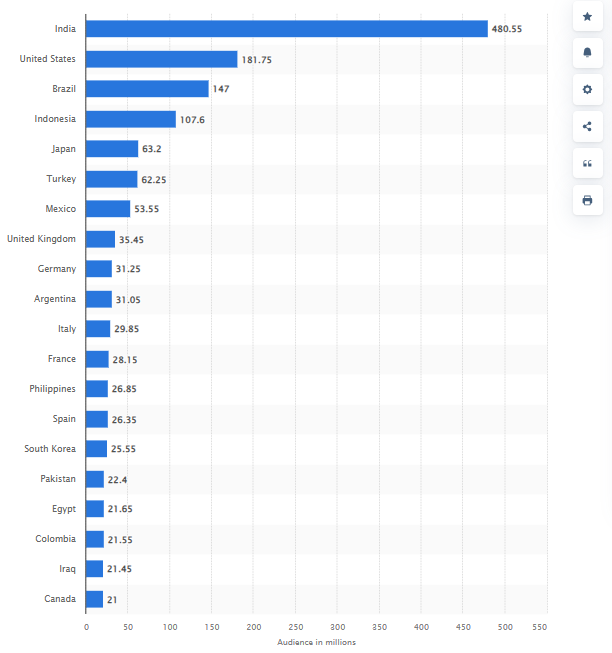
- Regarding Instagram user statistics, India is the top-leaning country with over 362.9 million people using the platform. The United States and Brazil have 169.65 and 134.6 million users. Is this data enough for you to develop an app like Instagram?
- Year-on-year, Instagram has experienced a high growth among users with about 25.3%.
3. YouTube
- YouTube is considered the second-largest platform with 2.5 billion users worldwide.
- In 2024, you should note that this social media platform has more than 122 million daily active users, which can be a reason to develop an app like YouTube.
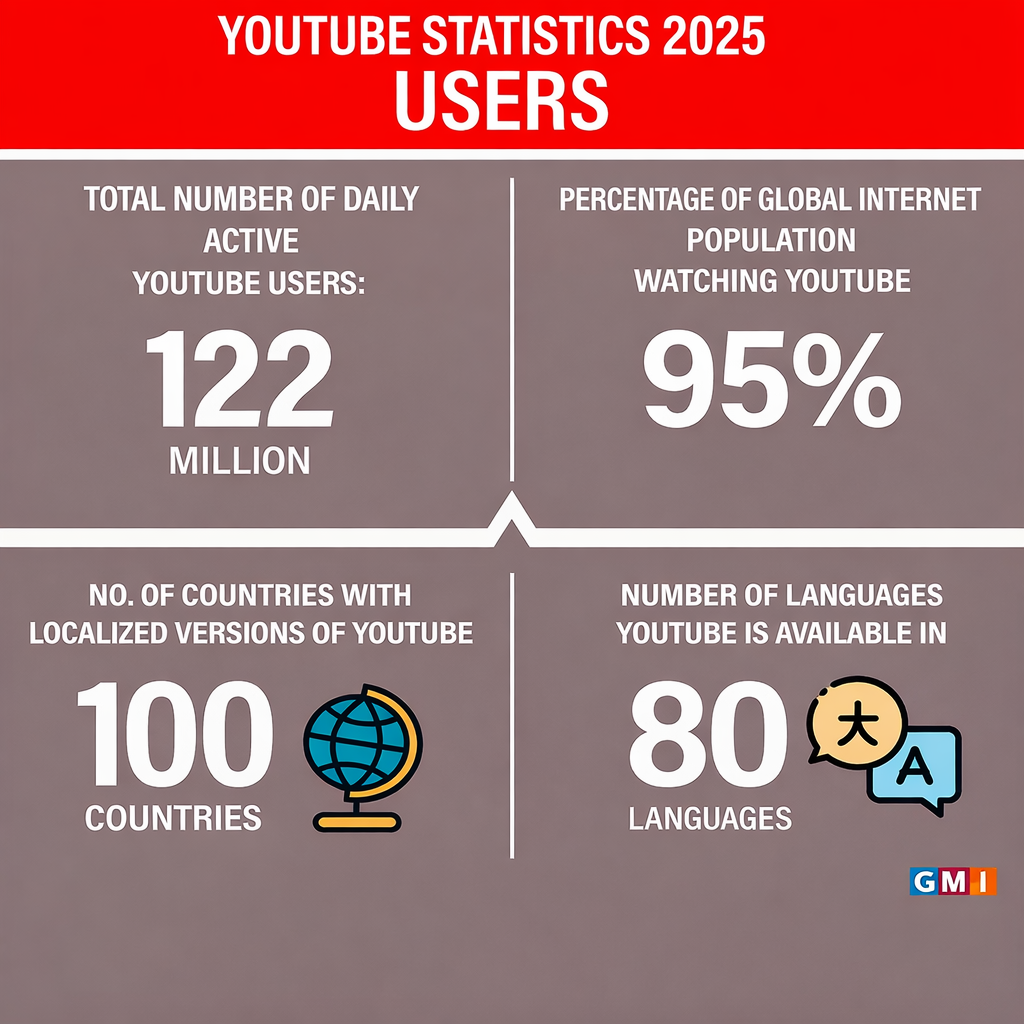
- Along with this, YouTube Premium and music together have 100 million plus subscribers in the world.
- Between July and December 2023, the global traffic came from desktop services. On the other hand, 90% of the visits were made through mobile and smartphone devices.
4. LinkedIn Statistics
- The highest number of users on LinkedIn was about 59.1% between the ages of 25 and 34.
- During 2022, LinkedIn generated an annual revenue of 13.8 billion U.S dollars.
- In 2022, there were about 571 million global LinkedIn Users and 174 million LinkedIn premium subscribers.
- The global number of users over the platform increased between 2024 and 2028 by a total of 171.9 million users.
Bonus Read: Develop an App Like ZipRecruiter
5. WhatsApp
- WhatsApp counted roughly 3 billion global users in the year 2025. And two billion monthly active users globally.
- The platform is used to send more than 100 billion messages each day.
- India has the top 596.6 million WhatsApp monthly active users. The platform is the 8th most downloaded app in the world.
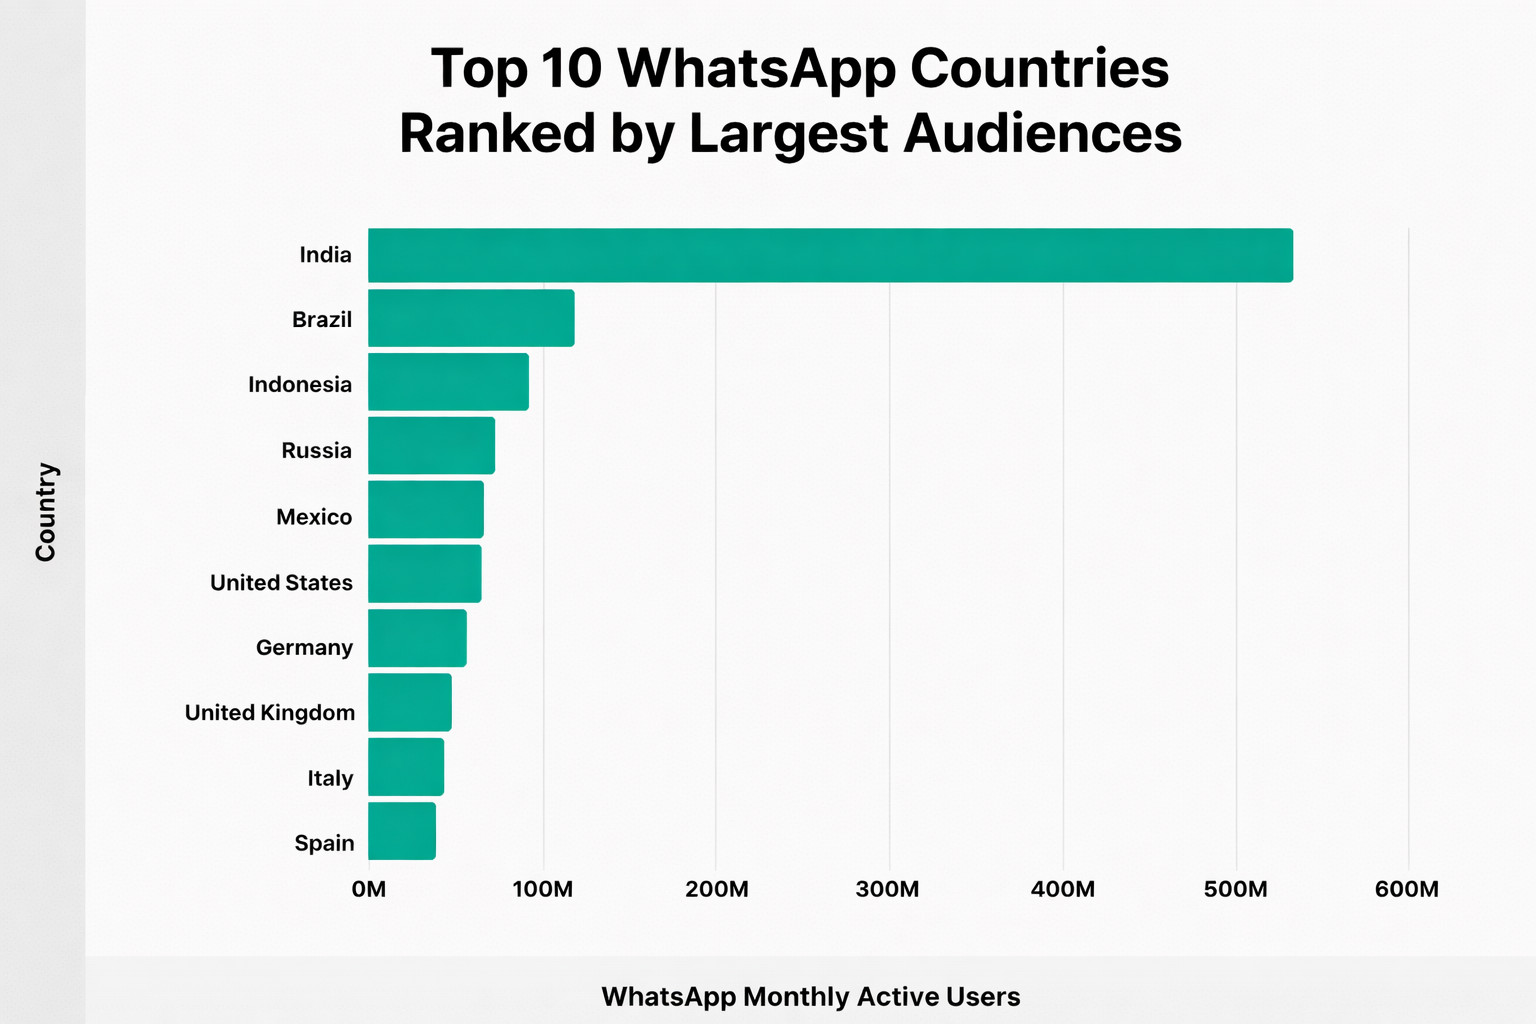
- 70% of WhatsApp users visit the app every day, which can be a significant reason to develop an app like WhatsApp.
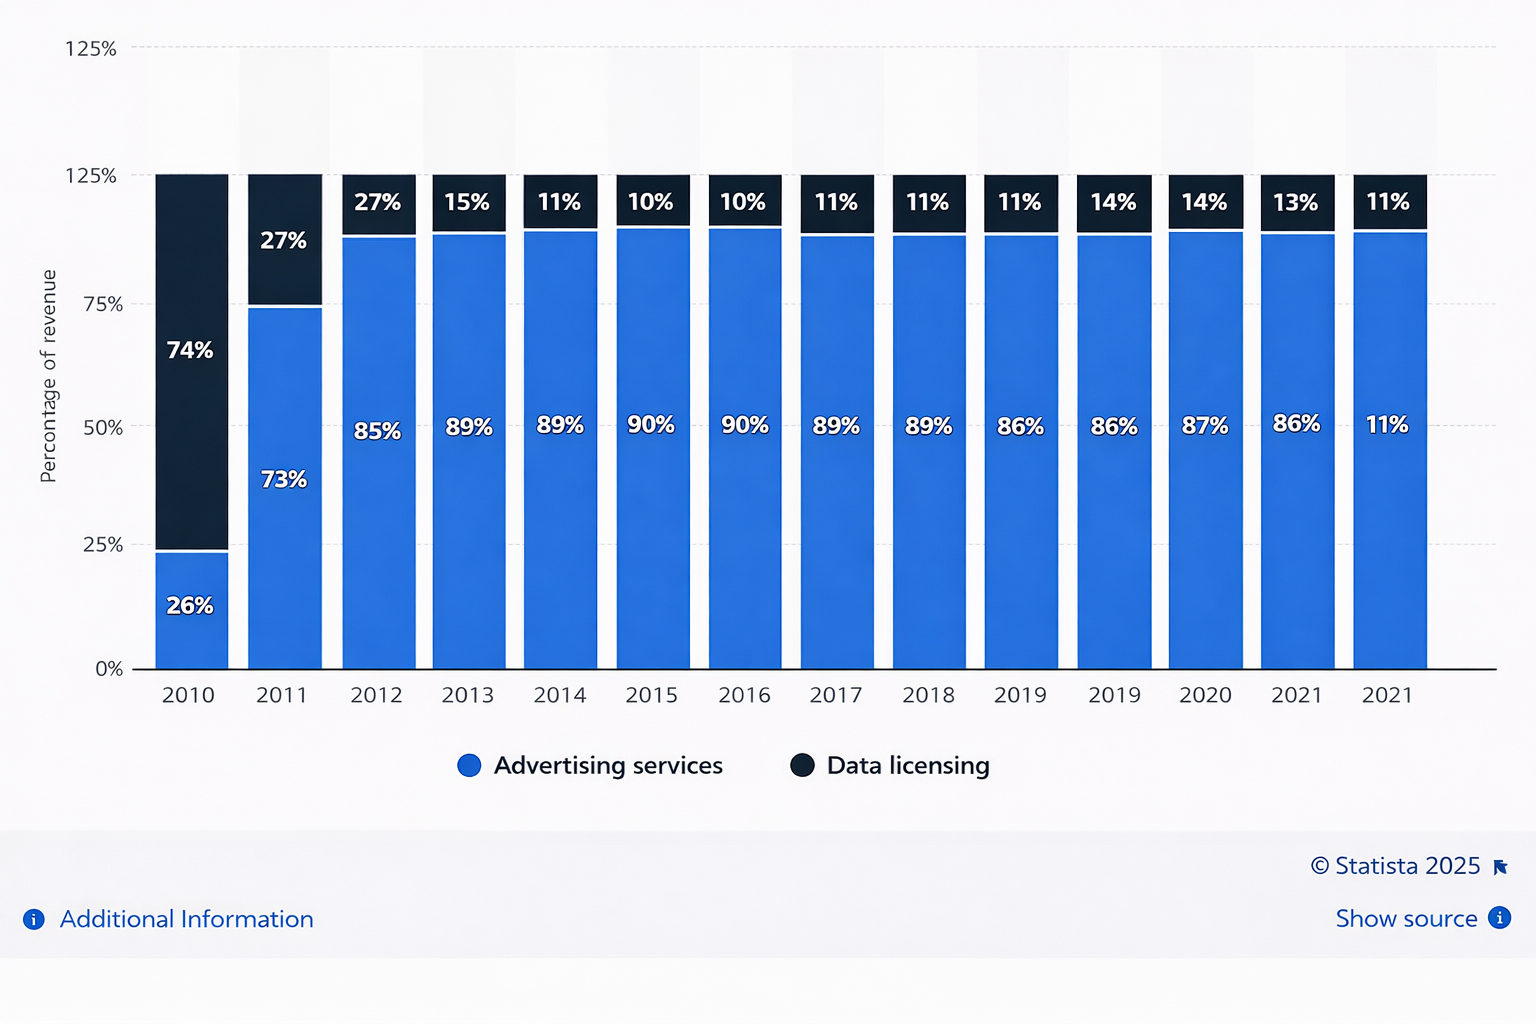
6. X (Twitter)
- The platform accounted for over 500 million monthly active users in 2024.
- X generated over 89% of its revenue through advertising services. Along with this, 11% was generated through data licensing.
- In 2023, there are an estimated over 100 million of these users from the United States.
- To make an app like X/Twitter, you should know that the platform has reached 12.6% of internet users worldwide.
7. Snapchat
- Snapchat generated an annual revenue of approx 4.6 billion U.S. dollars.
- Snapchat has 422 million+ daily active users

- Over 397 million people use Snapchat daily, with 26% based in the United States. This can be a motivation for you to develop an app like Snapchat.
While these are the biggest platforms that dominate the market, there are some emerging players too, who are worth mentioning.
Threads (by Meta) and BlueSky have been able to make so much impact on the user experience, giving users a fresh outlook on social media platforms, driving users despite the top 5 dominating the market.
Social Media App Statistics: Revenue Predictions
Till now, you have gathered information related to worldwide social media app statistics. Along with particular social media traffic statistics.
Now, let’s talk about revenue. Several businesses often find it difficult to understand exactly how social media apps make money. Well, irrespective of the strategies deployed, there’s one thing that is clear: social media platforms generate huge volumes of revenue.
Take a look at the following social media statistics :
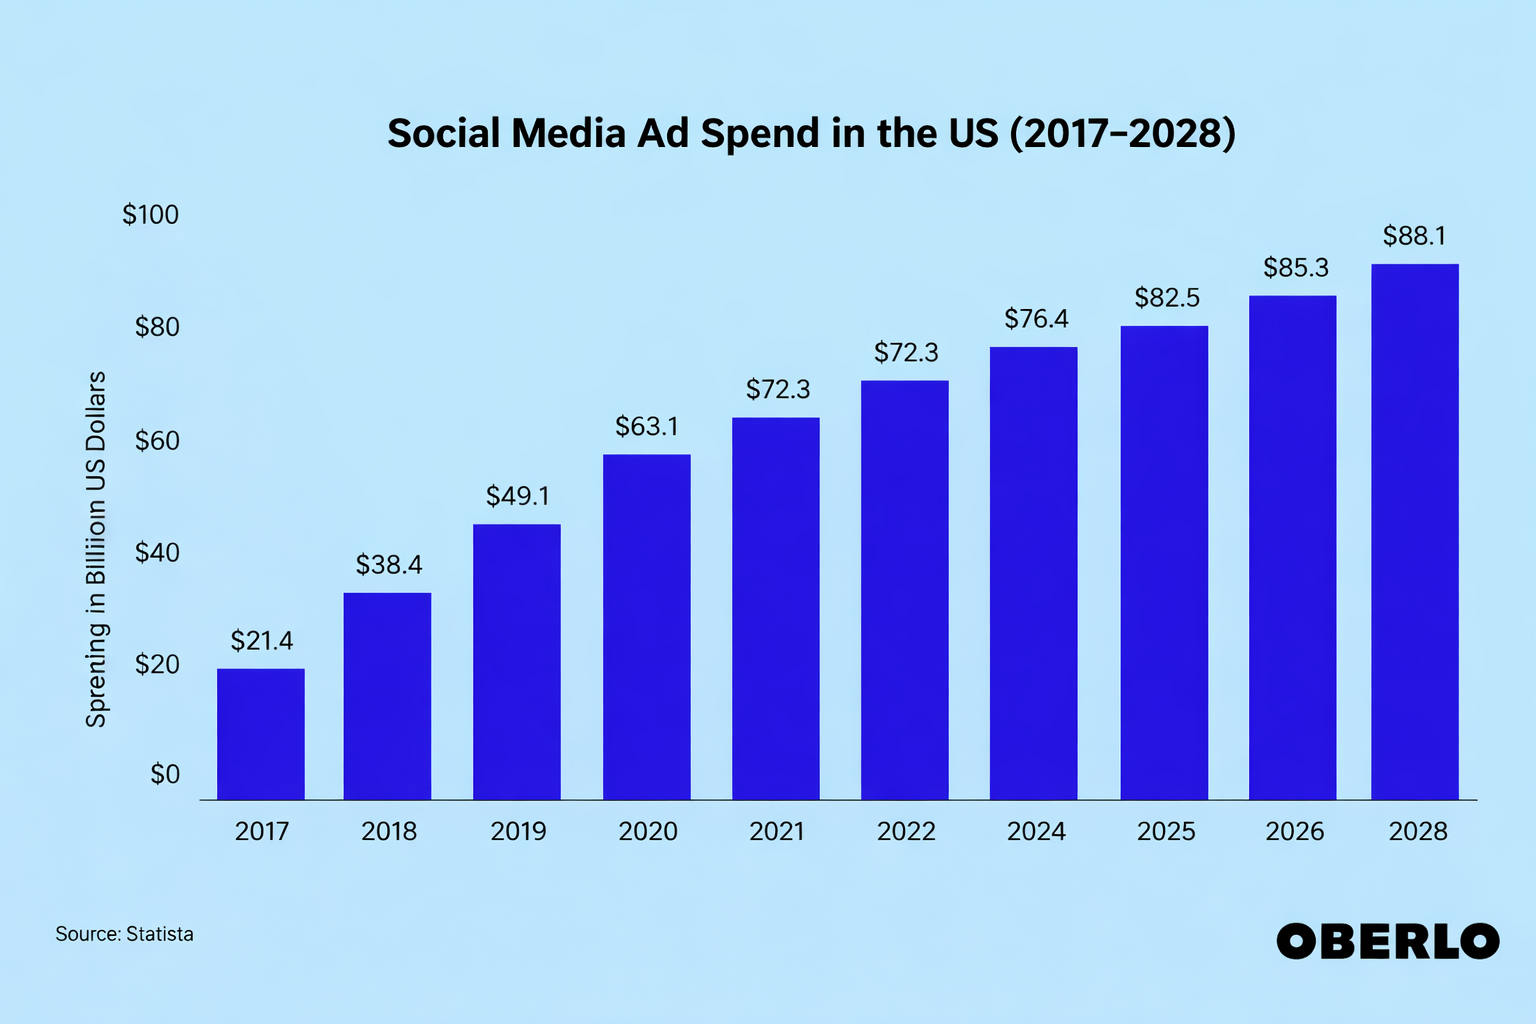
- Social media marketing facts revealed that the amount spent on social media advertising market has been expected to reach US $276.72 billion in 2026.
- The ad spending in the United States is expected to show an annual growth rate of 4.3% in 2026, which is resulting in a projected market volume of US$79.7 billion.
- Marketing statistics for social media show that in the year 2025, Facebook’s advertising revenue surpassed 176 billion US dollars, with overall social media spend of over 256.5 billion US dollars.
- Instagram was the most used influencer marketing platform among marketers in the United States. 68% of marketers use influencer marketing, followed by 52% of marketers on Facebook.
- As per social media influencer statistics, TikTok surpasses YouTube as an influencer marketing platform.
From the data mentioned, related to social media platform statistics. It can be stated that if you are wondering about developing one of those apps, you are going to be another billionaire. With tons of marketing through social media apps, marketers and businesses that like to sell their products and services via these platforms can be one of your major clients.
Social Media Networks Demographics Based on Regions
Based on the social media usage statistics by country and region, Asia accounted for over 1.3 billion social media users. On the other hand, Southern Asia had over 1.1 billion social media users. While 856 million people use the platforms in America, and 731 million in Europe.
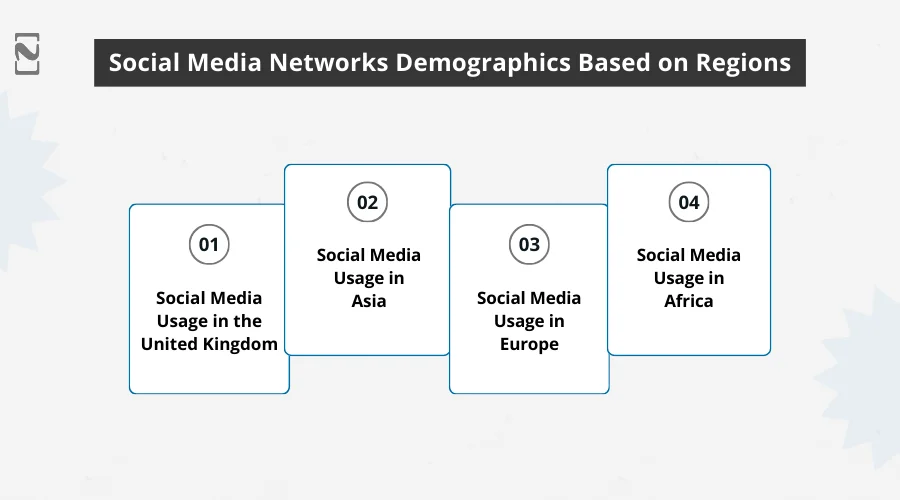
➤ Social Media Usage in the United Kingdom
- In 2023, social media users in the UK stood at about 62 million. The total number of users is expected to reach 65 million by 2027.
- In the UK, social media is the most popular platform among Gen Z and millennials, with over 98% reach with both generations.
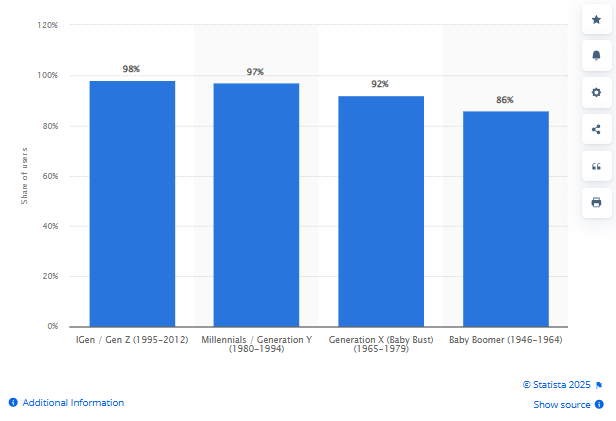
- The number of social media users has been continuously increasing over the past years.
➤ Social Media Usage in Asia
- In the Asia-Pacific regions, Chinese citizens displayed a strong online presence on these platforms, showcasing social media growth statistics.
- The second and third-ranking countries were India and Indonesia, which had 462 and 139 million social media user accounts.
- In October 2024, Facebook accounted for nearly 62% of the social media market across Asia.
➤ Social Media Usage in Europe
- When it comes to Europe, sending private messages over social media platforms was the most common activity for people in Germany and France.
- According to social media popularity statistics, Facebook has the largest indicator reach with 470.66 million users; however, Tumblr has been ranked last with 9.31 million users.
- In the year 2022, a survey conducted showed that almost one-third of the millennial and Gen Z users in Europe used social media platforms to cook food, while 56% stated that they cooked meals that are trending.
➤ Social Media Usage in Africa
- In Northern Africa, around 40.4% of the percentage of people using social media stood at 41.6%. While in central Africa, it was only close to 10% of people.
- The number of social media users is continuously increasing to over 384 million in 2022.
- Facebook is one of the leading platforms in Africa in terms of Market Share.
Social Media Penetration Rate Across Countries and Territories
Now, as you cover the social media regions and platform usage across demographics, it’s time to learn the social media penetration rate across diverse countries.
Before that, here’s what penetration refers to:” social media penetration rate displays the amount of popularity of the platform across the given country.
- The highest penetration rate is possessed by the U.S. with 115%, followed by Saudi Arabia, 96.2%, and South Korea, 93.4%.
- Hong Kong has an 83.9% penetration rate, followed by Spain and others.
- In April 2024, Northern and Western Europe were among the regions with the highest penetration rate with 78.7% and 77.1,% respectively.
- However, Eastern and Middle Africa have the lowest penetration among all with 11.1% and 10.1,% respectively.
Alright, here’s some more to go with the social media statistics report on gender and occupation. Let’s count on them one after the other.
Gender-Wise Usage of Social Media Platforms
Now, as you covered most of the social media stats report, you can view the social media comparison statistics between men and women here.
This section will assist you in identifying the gender distribution of the market that you need to target for social media app design.
- As of April 2024, 49.2% of the global Instagram audience is women, giving this platform the highest share of female audience among the selected social media platforms.
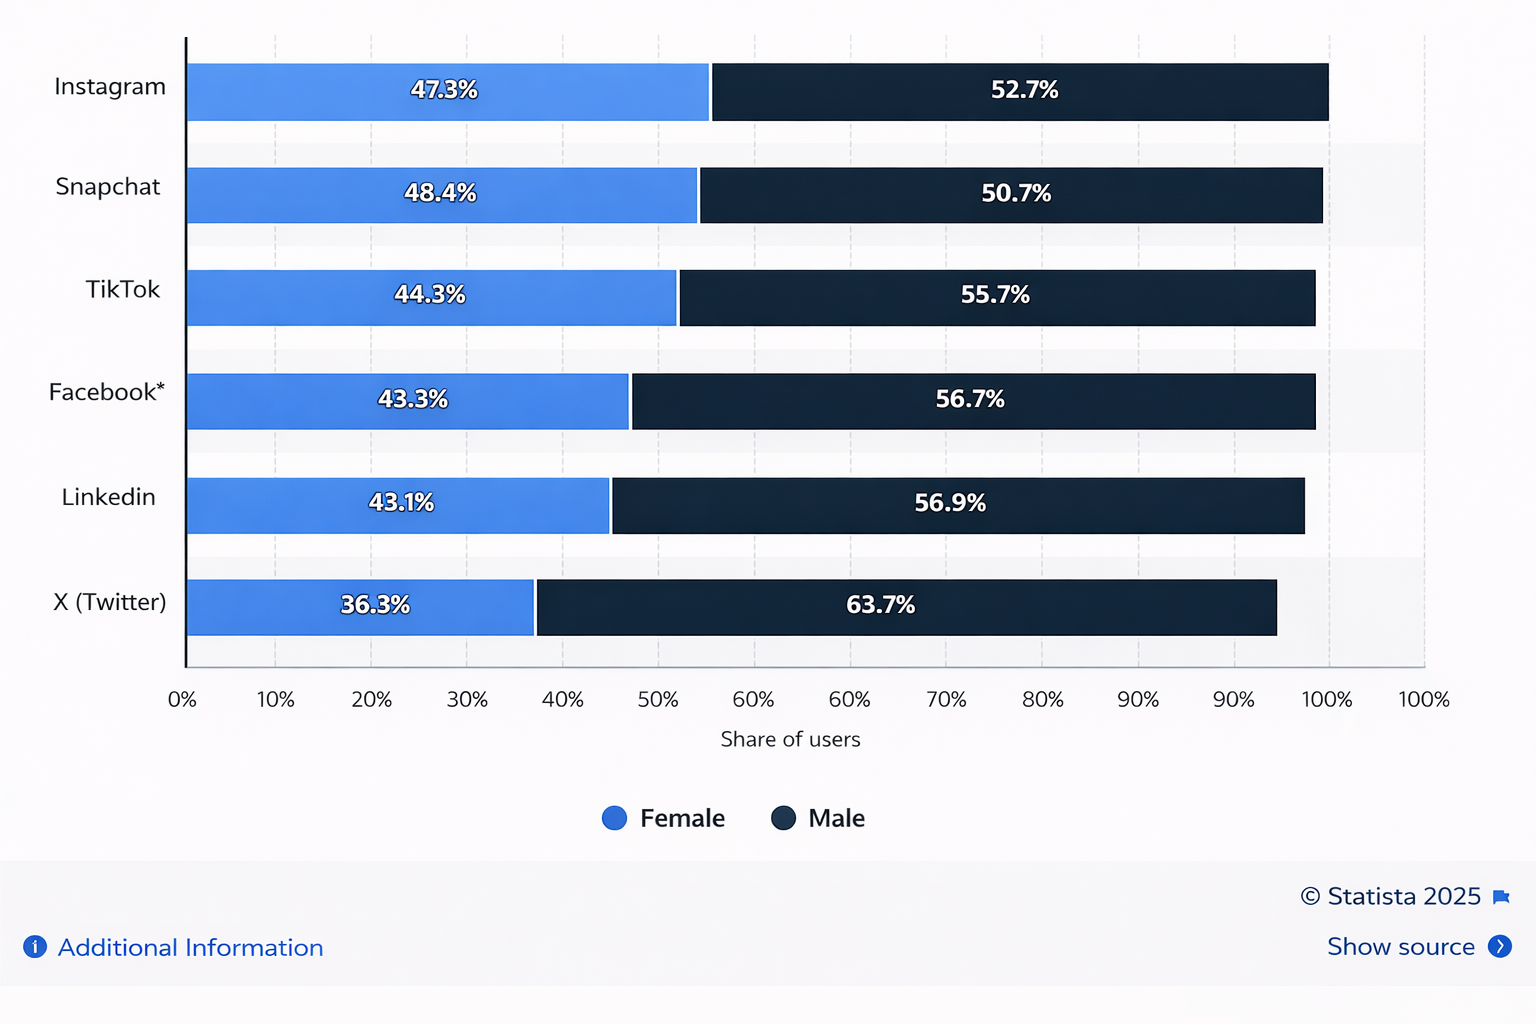
- 49.1 % of users are identified as women using the photo-sharing app, Snapchat.
- On the other hand, Twitter (X) was by far the platform with the highest number of male users and accounted for 60.3% of its worldwide audience base.
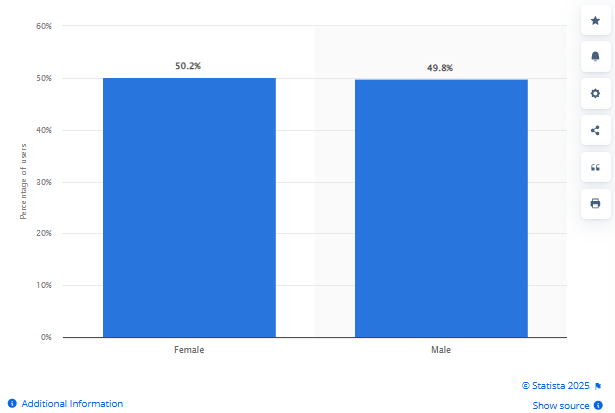
- As of January 2024, 51.2% of the social media users within the United States were women, and 48.8% were men.
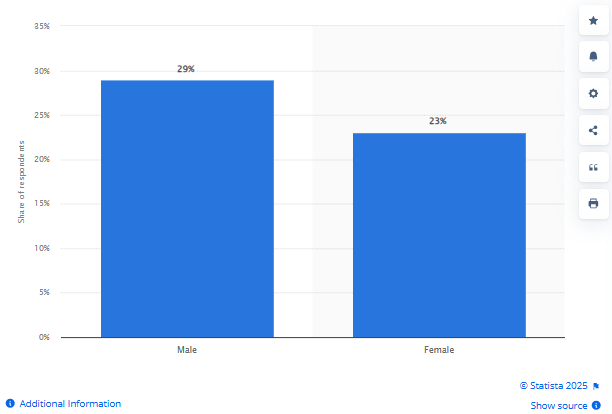
- Based on the September 2023 data, 27% of males in the United States stated that they use Reddit more as compared to 17% of females.
- As per Pew Research, Reddit has been used by more Americans than women. 64% of women are using Facebook, while only 35% of men are using the platform.
- 56% of men use Twitter rather than 43% of women.
Demographic Usage of Social Media Platforms
Did you notice from the gender-wise section that women are more inclined towards social media platforms, while men use them to have a particular type of information?
Okay! But what about the usage of social media as per different demographics?
Let’s have a look at it :
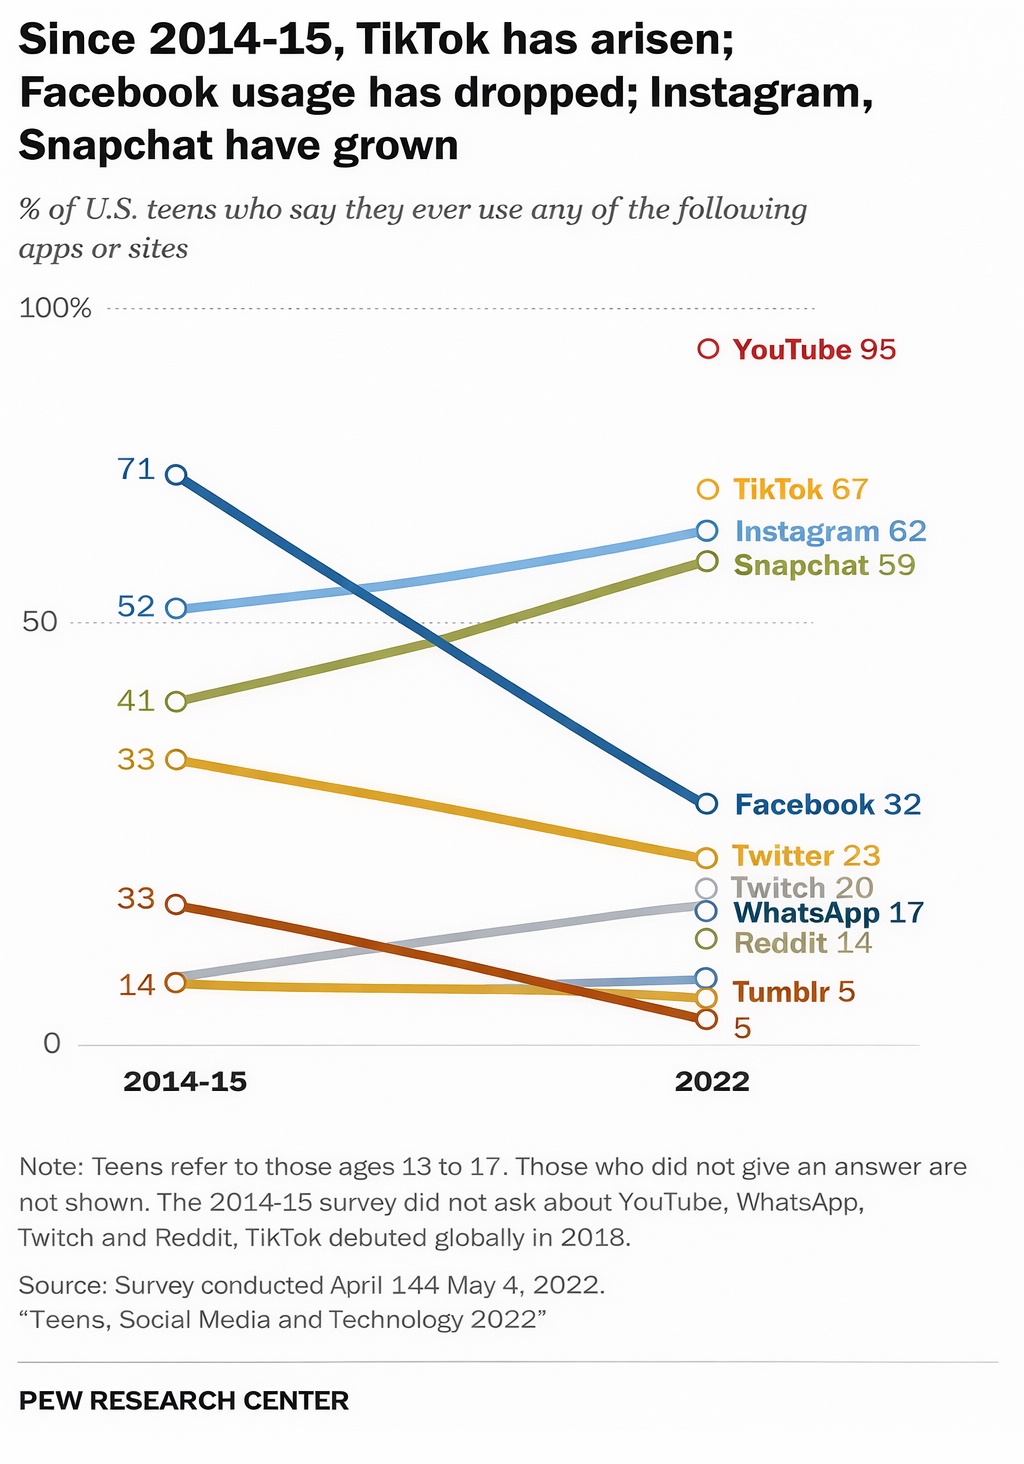
► Teens and Social Media
- TikTok usage is most common among black teens. 8 in every ten black teens, which is 81%, use TikTok compared to 71% of Hispanic teens.
- About 77% of teens stated that they use YouTube daily, and about half of them use Instagram or Snapchat once a day.
- Facebook usage among teens has dropped from 71% in 2014-15 to 32% in 2022. Twitter and Tumblr have also experienced declines among teens.
- As per Gen Z social media statistics, 54% of teens stated that it would be difficult for them to give up social media.
- 90% of teens aged between 13 and 17 have used social media.
► Usage of Social Media among Businesses
- 76% of local businesses use social media platforms as an important part of their marketing strategy.
- Although 41% of them rely on social media to drive revenue, according to social media statistics for business.
- 97% of Fortune 500 companies are totally dependent on social media for marketing, and more than 50 million small businesses use Facebook to connect with customers.
- Based on b2b social media statistics reports, 25% of B2C and 15% B2B respondents stated that they use Instagram for business.
► Workplace and Social Media
- 34% of workers use social media to take a mental break from work. However, 27% use it to remain connected with friends and family while at work.

- 17% of workers use social media to learn about their colleagues at work.
- Younger workers use social media channels to find information on social media that has improved their opinion of a coworker.
- Moreover, workers whose employers have an at-work policy of using social media are less likely to use the platform for their personal reasons while on the job.
Now, as we are proceeding towards studying the time horizons of using social media, you should know how much you are engaged with it.
Give it a think- How many times did you use social media platforms in a day? Social media statistics.
Time Statistics: How Much Time Users Spend on Social Media?
Social media platforms are built to engage us.
Let’s have a peek at social media engagement statistics to know the time spent using such platforms.
- In 2024, the average daily social media usage of internet users worldwide is 143 minutes per day, which has decreased by 151 minutes from the previous year.
- In Brazil, online users spend an average of three hours and 49 minutes on social media each day.
- Moreover, research from GWI displays that a social media user now spends 2 hours and 23 minutes per day over these platforms.
- On the other hand, social media app statistics revealed that the daily time spent on these social media platforms in the U.S was just two hours and 16 minutes.
- Based on a survey of research, it has been identified that more than 82% of respondents spent at least an hour per day on social media while at work.

Conclusion
The evolution of social media has become a revolution not only for the users of the app but also for businesses to directly connect with their customers. Approximately 5 billion people are using social media, and this number is projected to reach over six billion in 2028.
Social media statistics worldwide display that 58.8% of people stated that they use social media platforms to remain connected with their friends and family. Facebook was the first platform to surpass 1 million users and currently has 3 billion active social media users.
The highest social media penetration rate was found in the UAE, and China is one of the largest countries where most of the people are on social media platforms. 34% of workers use social media at work to take a break, and the average time spent on the platforms is 143 minutes per day.
However, the government is keen on reducing the negative impact of social media on the mental health of users.
FAQs

Niketan Sharma, CTO, Nimble AppGenie, is a tech enthusiast with more than a decade of experience in delivering high-value solutions that allow a brand to penetrate the market easily. With a strong hold on mobile app development, he is actively working to help businesses identify the potential of digital transformation by sharing insightful statistics, guides & blogs.
Table of Contents
No Comments
Comments are closed.