


Today, almost everyone owns a smartphone. Mobile usage is growing exponentially. Thus, It is clear that in 2020, every digital transformation strategy will need to incorporate mobile devices. But, knowing what goes in the mind of a mobile user is a daunting task. Therefore, we’ve put together a survey of several Mobile App Statistics user studies to find out the behaviour of smartphone users.
But, first thing first, why is there an increase in focus on smartphone users? According to Statista, among the total 4.8 billion mobile users globally in 2019, 73 percent of them (3.5 billion) are smartphone users. This number is rapidly increasing over time. Considering the fact that in 2016, just four years ago, there were only 2.5 billion mobile users. Furthermore, Statista reported that the number of mobile users will grow to 3.8 billion by 2021, marking an increase of 52 percent over the span of five years.
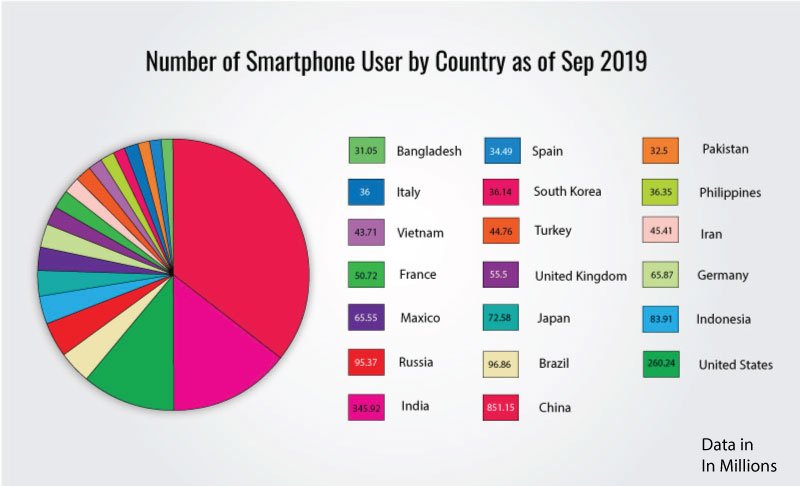
Unsurprisingly, being the most populous country in the world, China will account for the majority of the smartphone users. In 2019, China, India, and the USA were the countries with the highest number of smartphone users.
Due to Covid-19 Outbreak, Avg. Daily Mobile Usage have Increased
With the smartphones and tablets serving as a lifeline to the entire world during the Covid-19 outbreak, the dependability of people on mobile devices has increased. As a result, people started spending more time with their mobile devices. The pandemic has accelerated trends such as an increase in the time people spend streaming videos and playing games on mobile, with these trends being likely to last for a long time.
How the coronavirus pandemic has influenced the time spent on mobile devices?
Data from the USA states that a US adult has started spending 23 additional minutes per day on mobile phones due to the pandemic. Tablet users have also gained on-device daily usage time by 2 minutes, which is in contrast to the estimates from pre-pandemic research, where the usage was predicted to decrease in 2020.
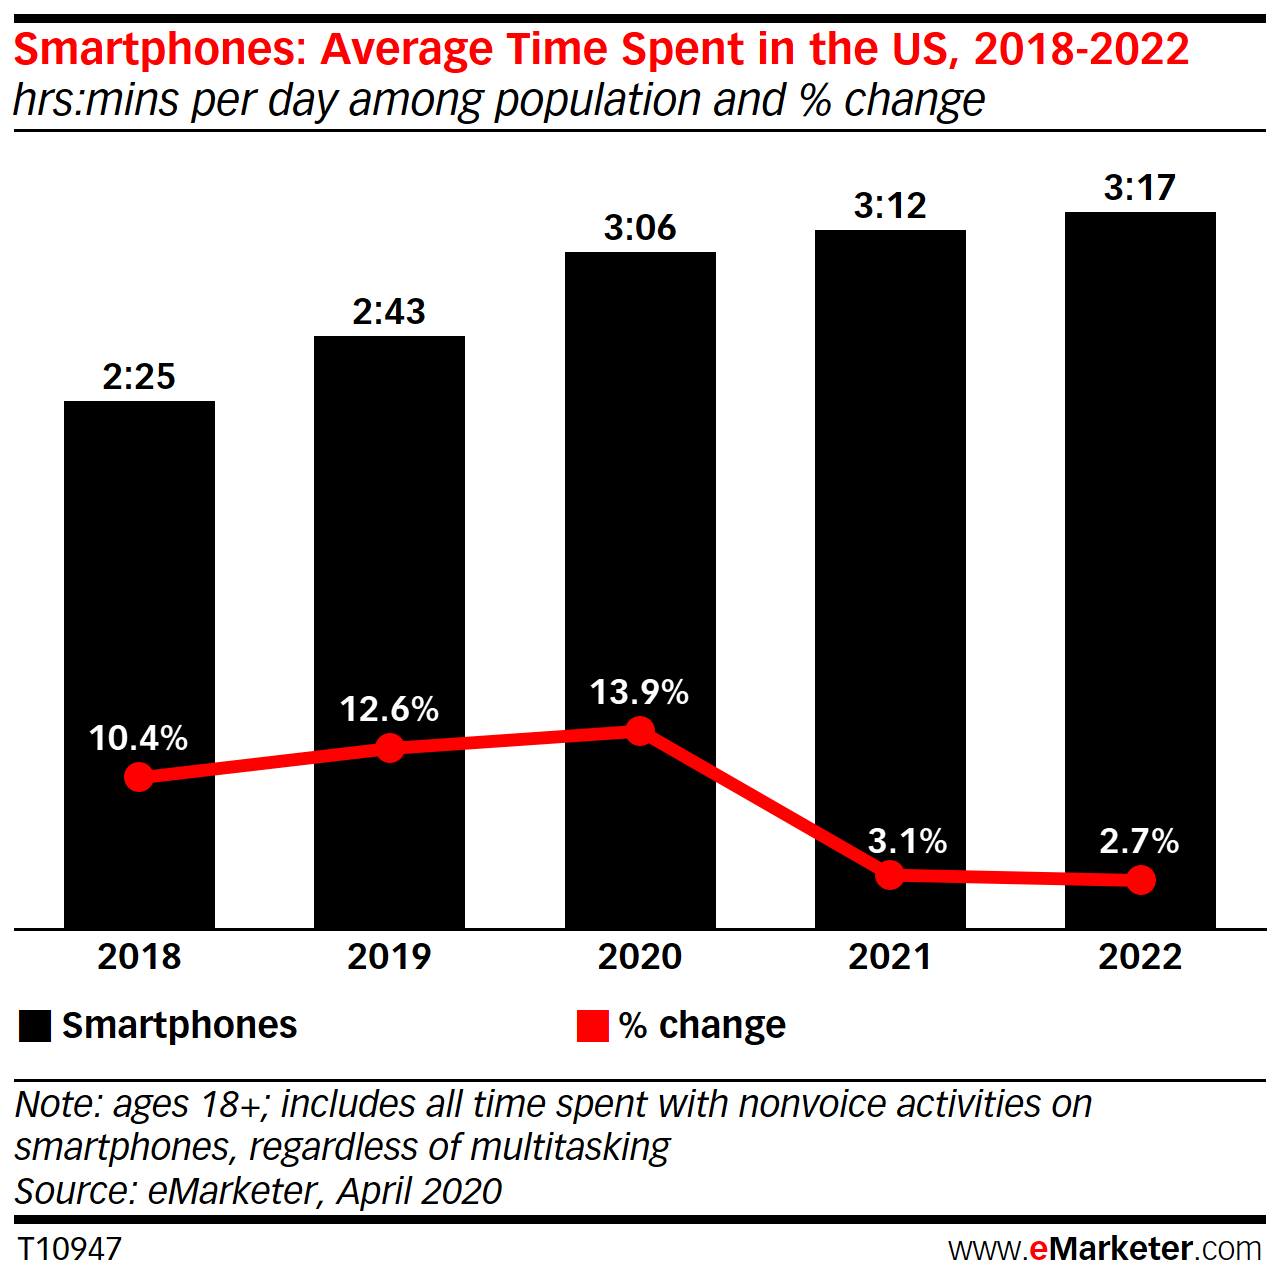
Source: eMarketer
More than 60% of B2B Buyers confirmed that their recent purchase was Heavily Influenced by Mobile Devices
If the mobile trend is increasing for general consumers, the B2B buyers aren’t lagging behind. In fact, the numbers are more impressive when it comes to B2B commerce.
In its report from 2017, Boston Consulting Group (BCG) found that 80 percent of B2B buyers use mobile devices at their workplace, while 60 percent of the respondents confirmed that mobile played a significant role in their recent purchases.
70 percent of the respondents stated that their mobile usages have significantly increased over the last two-three years while 60 percent confirmed that their use of mobile devices will continue to increase.
Millennials check their Phones 150 times a day
A study by Qualtrics and Accel found that Millennials check their phone 150 times a day. What is the reason behind such an obsession with mobile phones? This is largely down to our hormones. It has been public knowledge for the last decade or so ago that receiving or expecting new social media posts, emails, and text messages contribute to the release of dopamine in the human brain. This dopamine release triggers the brain into regularly checking if a new message or social media post is available.
General Mobile App Statistics For 2024
When it comes to mobile phones, users expect exceptionally high standard apps with eye-pleasing aesthetics and outstanding performance. For that, it becomes crucial for companies to provide seamless user experience across all the mobile devices. There is widespread confusion among people about the choice of technology for their mobile app development. To understand which technologies and platforms are the best for your app, read the following article here: Hybrid vs Native Apps.
Key Mobile App Statistics
- In 2019, the global mobile app revenue stood at $462 billion
- 204 billion mobile apps were downloaded globally in 2019
- 21 percent of the millennials open an app 50+ times a day whereas 49 percent of people open an app more than 11 times a day
- A smartphone user uses an average of 30 apps in a month
- 57 percent of all the digital media usage comes from mobile apps
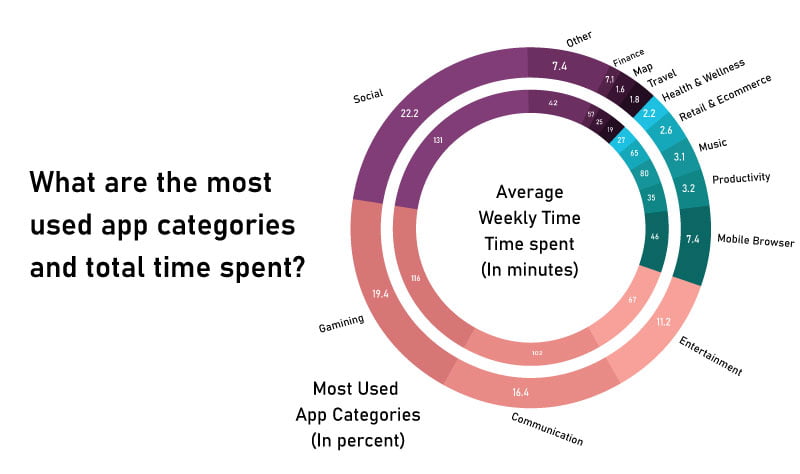
What kind of Apps do people often use?
A recent survey found that:
- Social Networking, Communication, and Gaming apps are the top three most used app categories for 58 percent of the users.
- eCommerce, Travel, Finance, and Maps are among the least used categories with less than 4 percent of users use them frequently.
- Around 75 percent of the respondents confirmed that they daily engage with the top five app categories – Social, Gaming, Communication, Entertainment, and Mobile Browser.
Mobile App Statistics by Industries
Food Restaurants and Quick Service Restaurants
- Compared to 2016, customers ordered food and beverages130 percent more often in 2018.
- In 2018, in the USA and Canada, food delivery mobile apps witnessed an increase in their usage by 175 percent and 255 percent, respectively from 2016.
Banking and Fintech
- In 2019, the banking and fintech apps downloads stood at 4 billion, a 75 percent increase from 2016.
- For banking and fintech apps the average session duration is 3.1 minutes.
Travel and Leisure
- By 2019, the top 5 car-sharing apps grew by the CAGR of 25 percent whereas scooter and bike-sharing apps witnessed a growth of 530 percent in 2018, from the year 2017.
- Travel apps have an average session duration of 2.8 minutes.
Retail
- November 2018 was the biggest online mobile shopping month in terms of sales value of all time.
- Shopping and retail apps leverage an average session duration of 4.6 to 5 minutes.
- From 2017 to 2019, mobile shopping apps grew up by 70 percent in the USA.
Mobile App Download Statistics
It is impossible for mobile apps to succeed without downloads. Most of the time app owners just overlook this very crucial aspect of mobile app success. You might have the best app on the planet, but if no one is downloading it, there is no point having it.
 So,
So,
before you create your app, you need to take your time in brainstorming and researching the app idea.The following mobile app statistics will help you know what lies in the future for your mobile app.
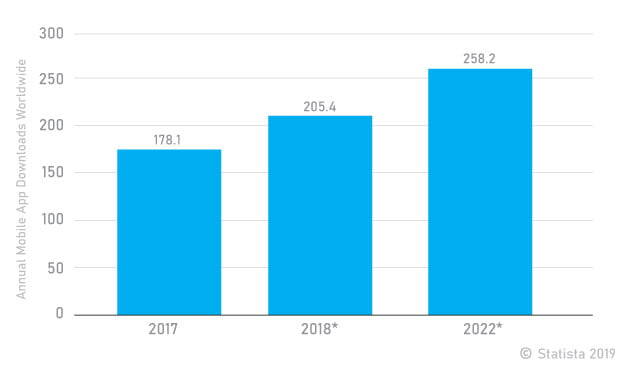
Global App Downloads are Increasing
As the global use of mobile is increasing, the number of app downloads is growing too. In 2018, the number of app downloads were more than 205 billion which is a 15 percent increase from the previous year. Statista predicts that there will be a 25 percent increase in the number of downloads between 2018 and 2024.
Free vs Paid Downloads
How will you make money with your mobile app? Before you create your app, you need to figure out your mobile app strategy for monetization. This is the reason you’re building your app, right? To make money. You might think of making the app paid at the time of download, but will your target user base download your app if it is paid? This is a question which you need to find out the answer for.
Let’s see what the numbers say:
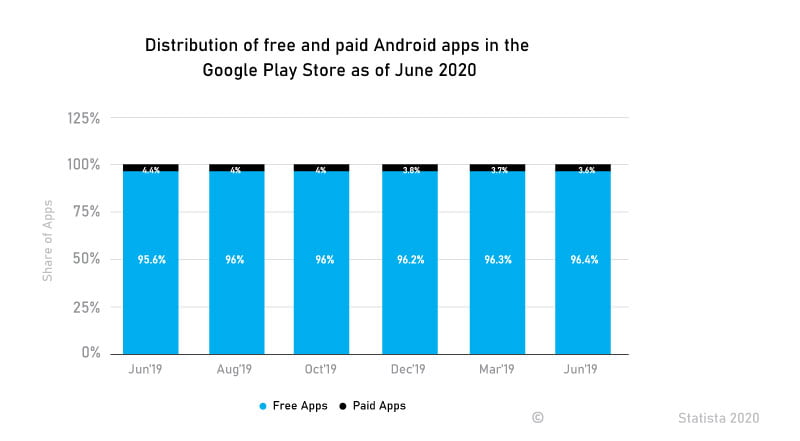
The data clearly shows that most of the apps on the play store are free. In fact, 98 percent of the mobile app revenue comes from free apps. A very small proportion of people are fine with paying for app downloads. But, it doesn’t mean you should completely dismiss the idea of introducing a paid app. It depends on your app niche and if there are benefits of both a free and paid app strategy.
Mobile apps that tend to engage the users more, and provide value and services that none of the free apps provide, can get away with being paid applications. But, if you charge users for your app download, less number of people will download your app. This is because people are used to being offered free apps.
However, you don’t necessarily have to charge for app downloads in order to make money via your mobile app. Increased customer convenience, product/service extension, advertisement revenue, premium subscriptions are some of the common ways to get return on investment from a mobile app.
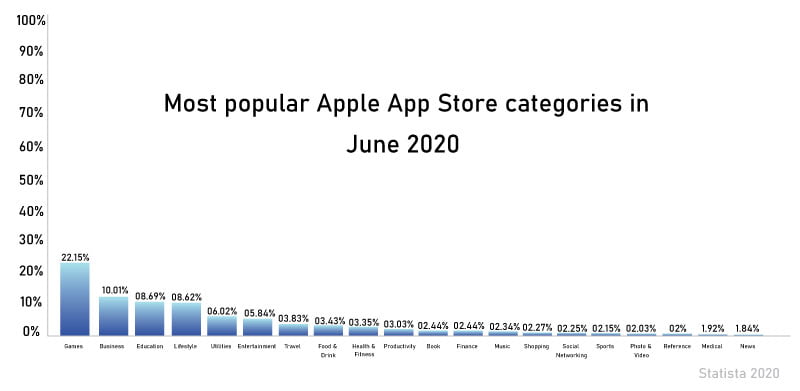
Games are the most resourced App Store Categories
Your app can be revolutionary in terms of technology and functionalities, but do you know if there is a market for it? If not, then you’ll spend a heavy amount of time and resources to generate the demand, which is a very hard task for startups. Here is the category-wise breakdown of apps in the Apple app store as of June 2020:
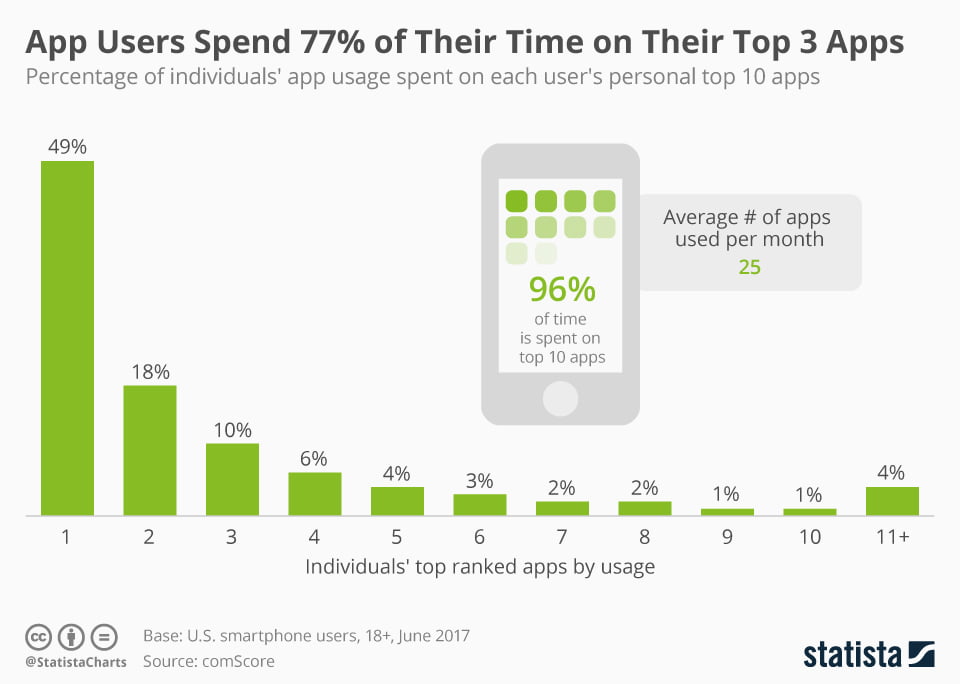
Users Spend 77% of their time using their top 3 Apps
Statista researched that American adults spend almost 18 hours a week using their smartphones. Undoubtedly, most of this time is spent using mobile apps and this is why it is crucial for brands to launch their own mobile app.
Having an app requires money and time, but once the app is built, you then need to get people to download the app and use it frequently, which is a challenging task. As per the reports, the scope of users using a new app frequently is very limited, as an average app user in the USA spends 77 percent of his time using their top three favourite apps and 96 percent of their time using their top 10 apps.
 Source: Statista
User Retention need to be Focused on
Considering the statistics from 2016 in Fortune magazine, 75 percent of apps aren’t used twice after being downloaded. So, there is no guarantee that your potential user will use your app even after downloading.
A common problem businesses face is that they see a surge in the number of downloads initially, but they struggle to make money because the users don’t tend to use the app consistently. So, how do you identify this issue and work towards mitigating it?
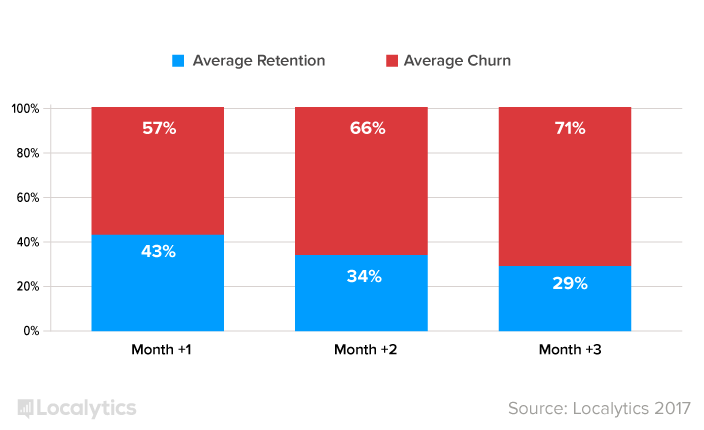
Source: Localytics
As the data indicates, 71 percent of the app users churn within their first three months. This Is why it becomes crucial for you to design your app in a manner that it keeps giving users a reason to keep using your app frequently.
Global App download will reach 258.2 billion by 2023
In the year 2017, mobile users downloaded 178.1 billion mobile apps globally. This number crossed 205 billion in the year 2018. As the adoption of the mobile device is increasing over time, it is expected that by 2023, the global mobile app downloads will reach 258.2 billion.
Conclusion
During and after the pandemic, mobile apps will be a major part of our lives. Even though the mobile device usage and app penetration is at an all-time high, every piece of data and reports we see indicates that this trend will continue to grow.
This seems encouraging for businesses who already have a mobile app, or are planning to build a new one. But, it is foolish to just develop and manage a mobile app without analysing the demand and trends.
Thus, use the aforementioned statistics to form your mobile app strategy. If you’re ready to develop your app, reach out to us with your requirements at contact@nimbleappgenie.com. We are experts in developing both Native mobile apps and Hybrid applications .

Niketan Sharma is the CTO of Nimble AppGenie, a prominent website and mobile app development company in the USA that is delivering excellence with a commitment to boosting business growth & maximizing customer satisfaction. He is a highly motivated individual who helps SMEs and startups grow in this dynamic market with the latest technology and innovation.
Table of Contents


No Comments